KEY TAKEAWAYS
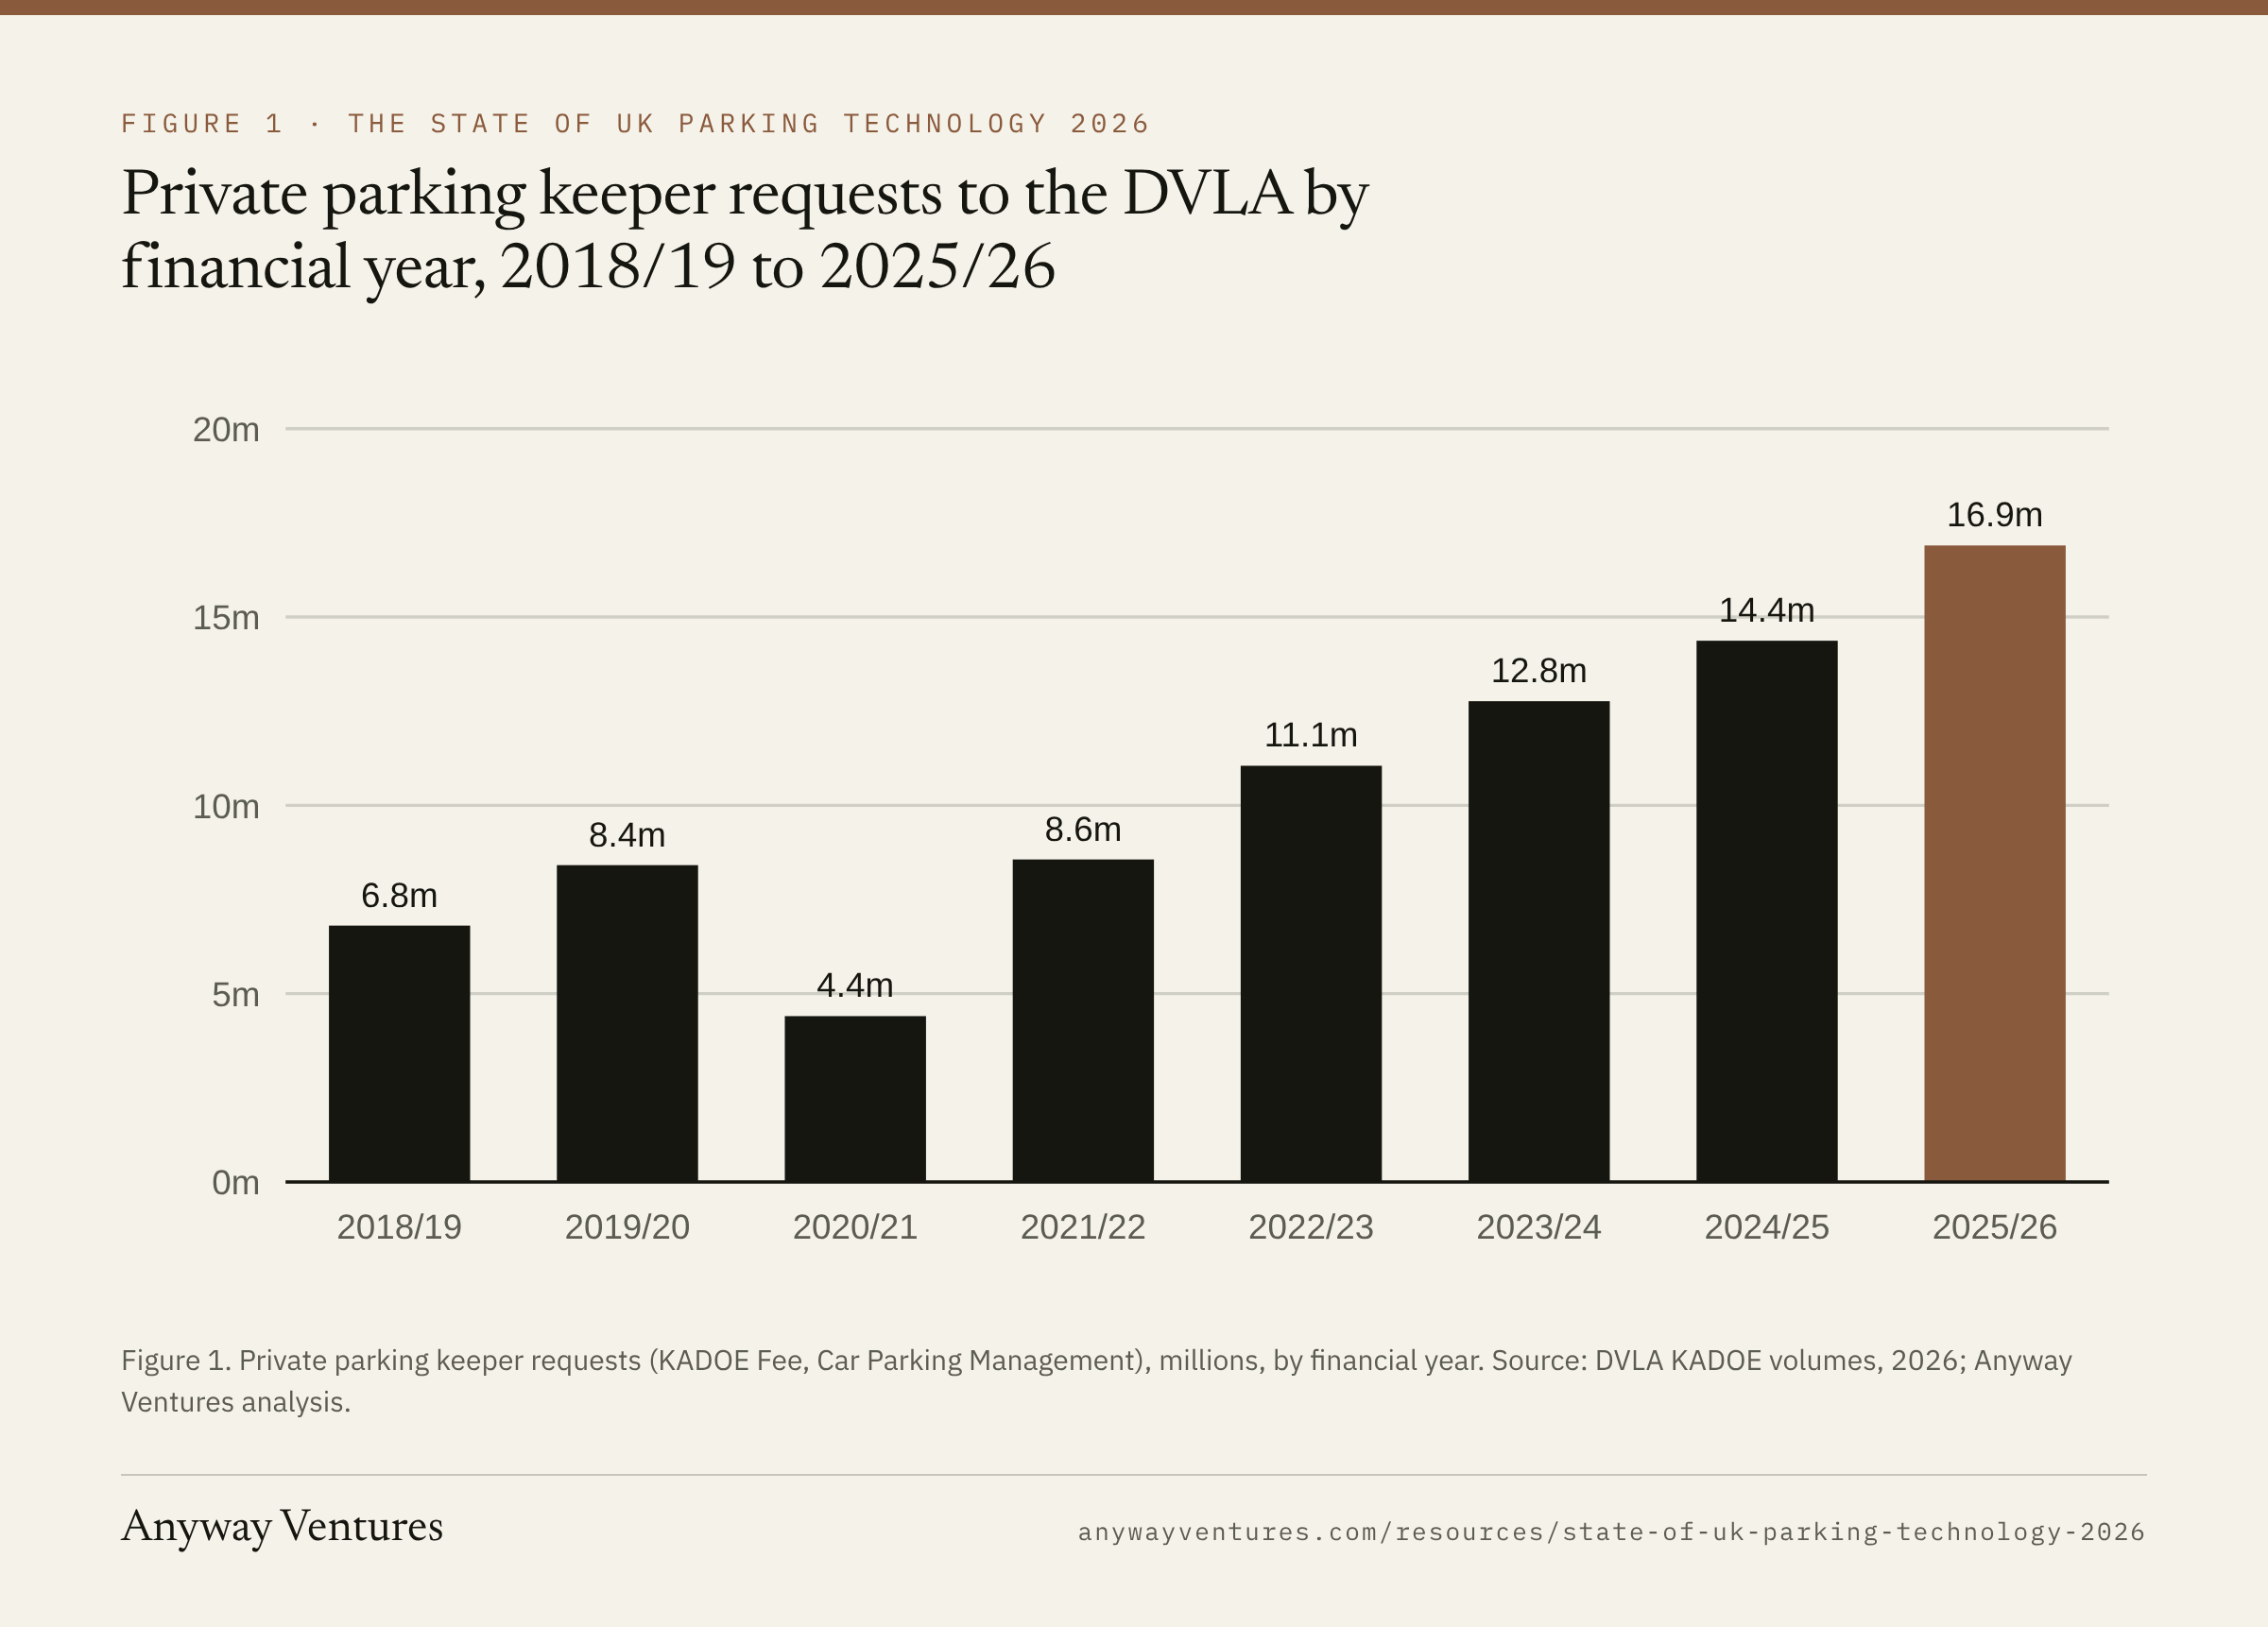
- Private parking operators made 16.9 million DVLA keeper requests in 2025/26, 2.5 times the 2018/19 level, and since 2024/25 they have made more requests than every council in Great Britain combined.
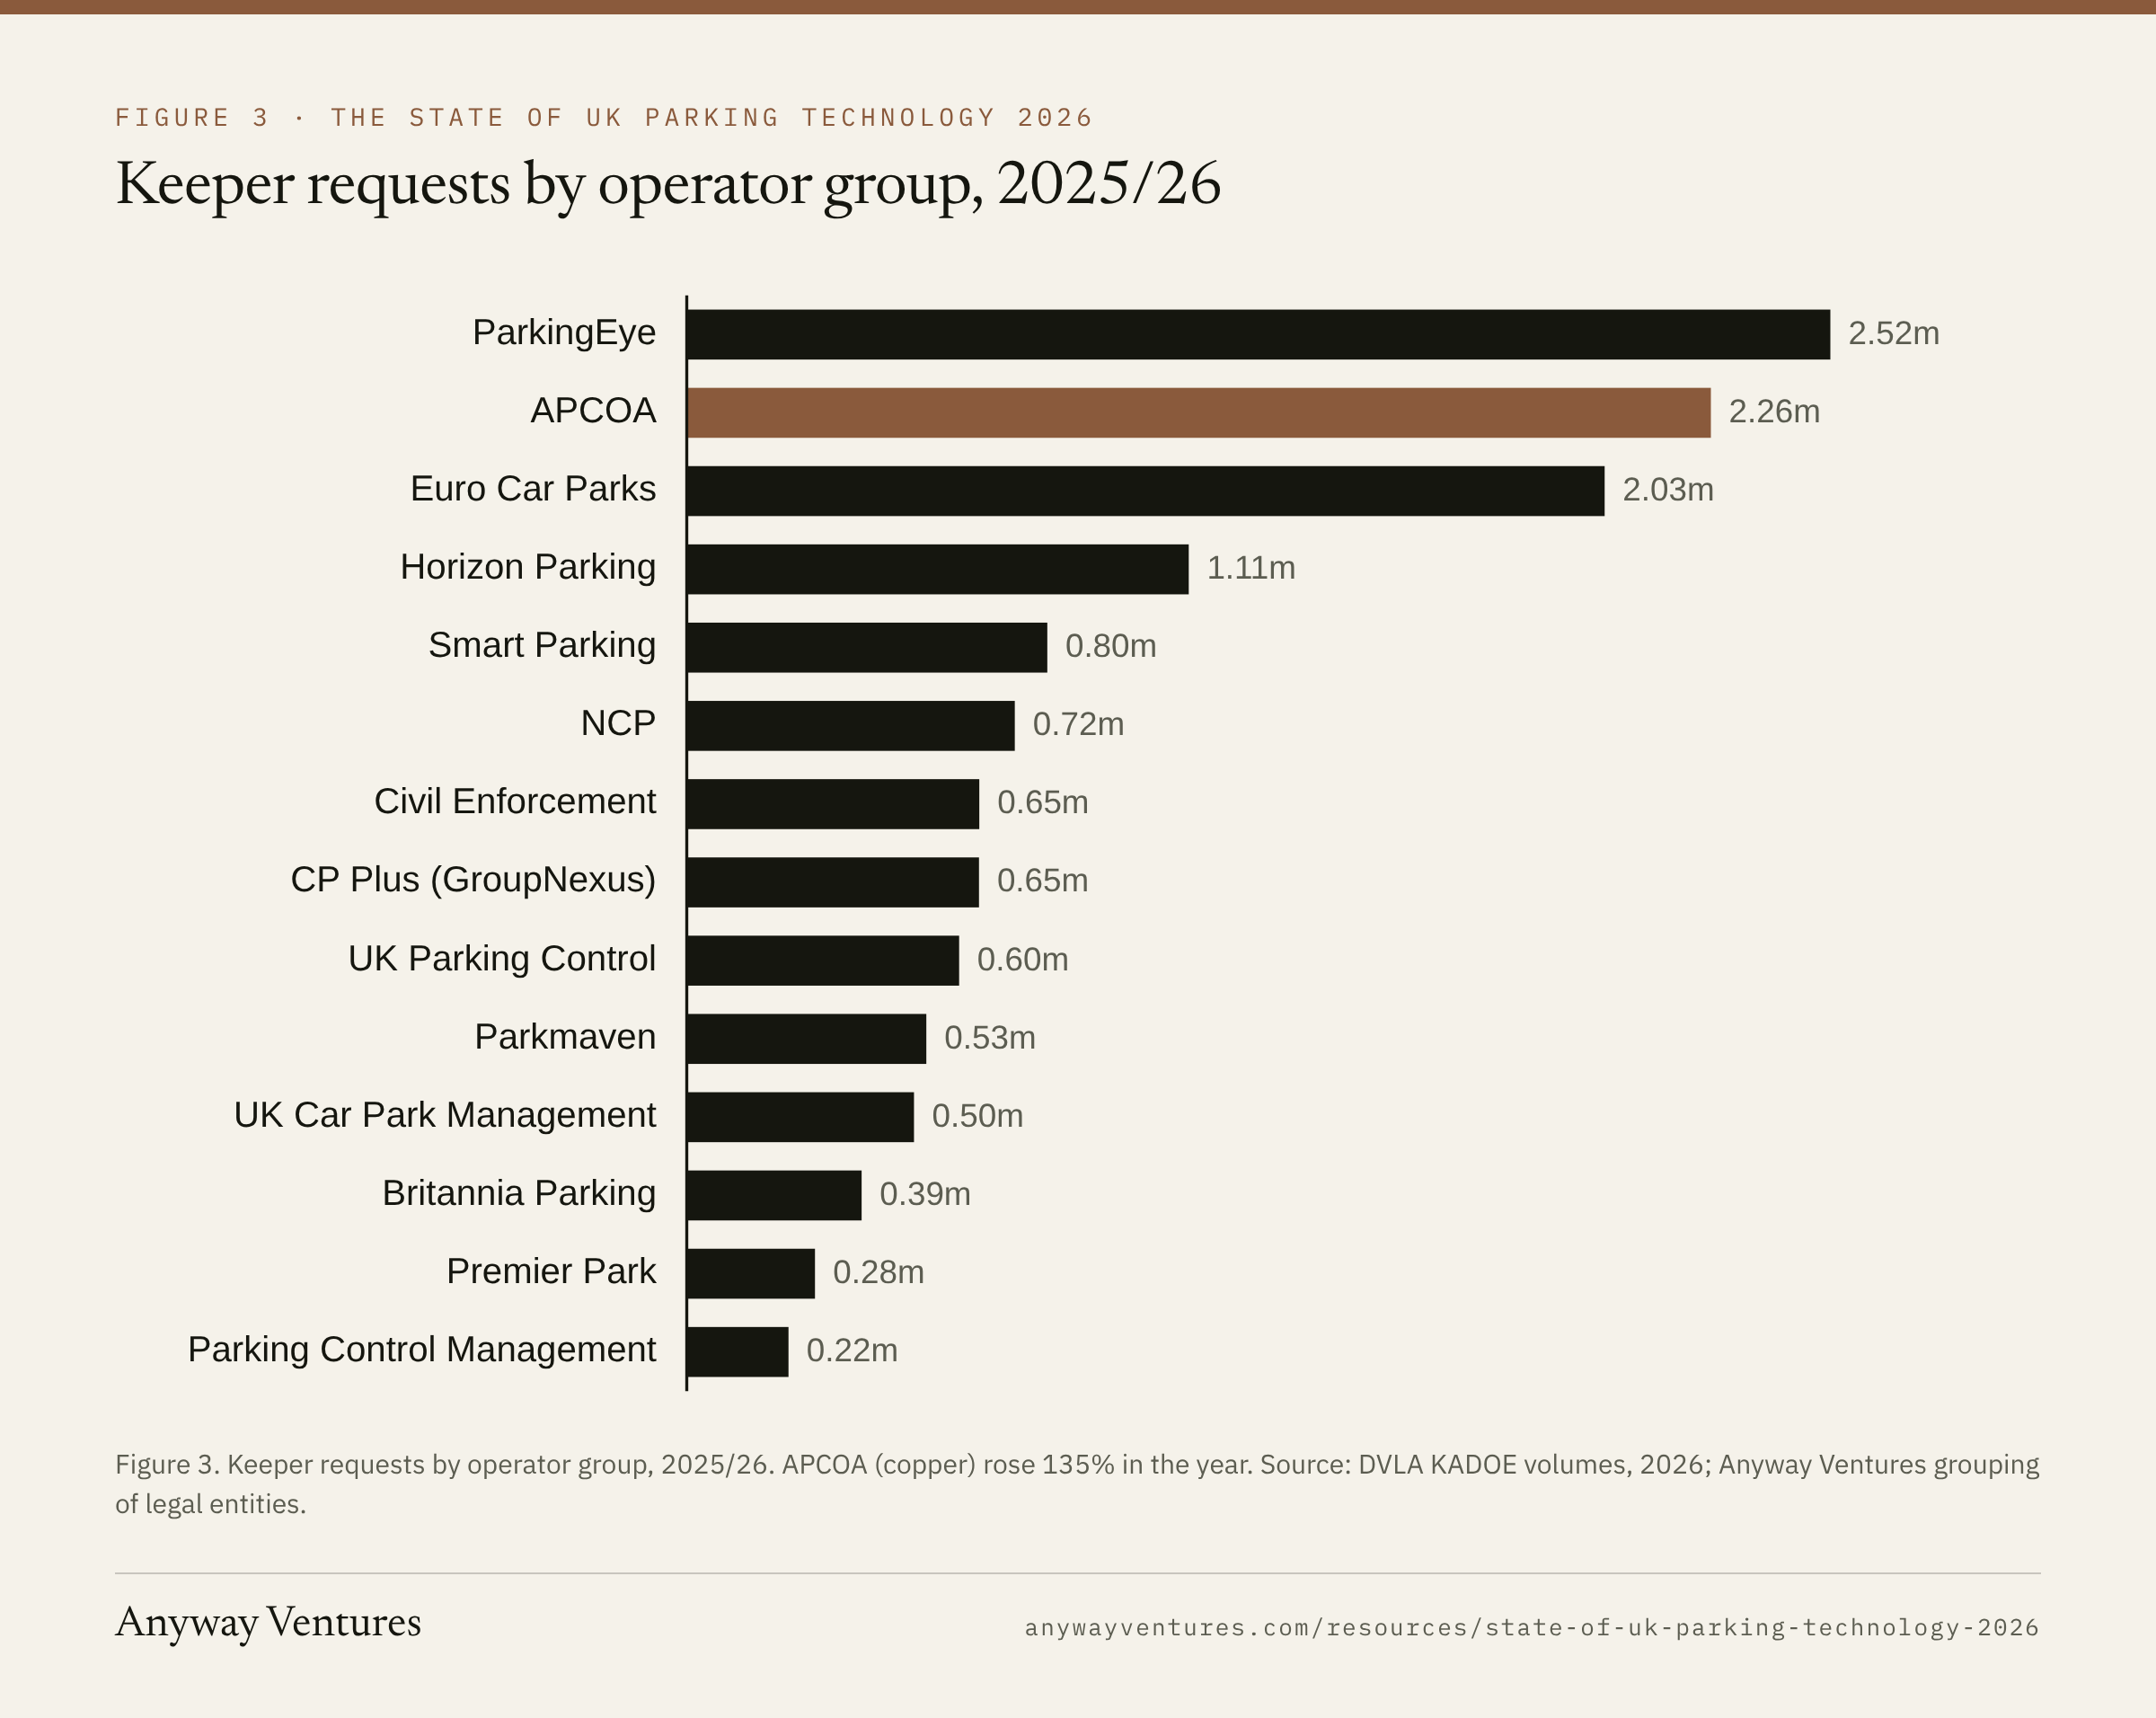
- The three largest operators, ParkingEye, APCOA and Euro Car Parks, made 6.81 million requests in 2025/26, the same number the whole industry made seven years earlier.
- POPLA appeals per 1,000 keeper requests fell from 11.3 in 2019 to 6.6 in 2025, because charges grew six times faster than second-stage appeals.
- English councils made a £1.094 billion parking surplus in 2024/25, but off-street car park income is below its 2019/20 level in real terms while on-street income is above it.
- The government's impact assessment values the 2026 code at £327.5 million over ten years to operators, and the data needed to test that figure is exactly the data the industry has never published.
This report is an original analysis of the UK parking industry in 2026, built from public data that we collected, checked against primary sources, combined and analysed: eight years of DVLA keeper requests broken down by operator, council parking finances in England and Scotland, second-stage appeals, the government's impact assessment for the 2026 private parking code, payments and the National Parking Platform, EV charging and every deal since 2019 we could verify. It is written for investors and deal teams, operators, app and software businesses, councils, trade bodies and journalists who need numbers they can cite, and it is equally clear about the numbers that don't exist. Every dataset is in the free Excel appendix, with sources, dates and notes.
Anyway Ventures is led by Brannan Coady, who was Chief Product Officer, then COO and CEO, of YourParkingSpace from 2016 to 2024. Flowbird acquired YourParkingSpace from Pelican Capital and its founders in July 2022; he then served on the Flowbird executive committee and was on the deal team for Flowbird's sale to EasyPark, now Arrive. That is the vantage point for the questions this report asks. The answers come from the data.
1. Executive summary
- Private enforcement has more than doubled in seven years. Private parking operators made 16,900,805 keeper requests to the DVLA in 2025/26, against 6,808,344 in 2018/19: a compound growth rate of 13.9% a year, and 18.5% a year since the post-Covid restart in 2021/22. That is about 46,300 requests a day and roughly £42 million a year in DVLA fees at £2.50 a record.
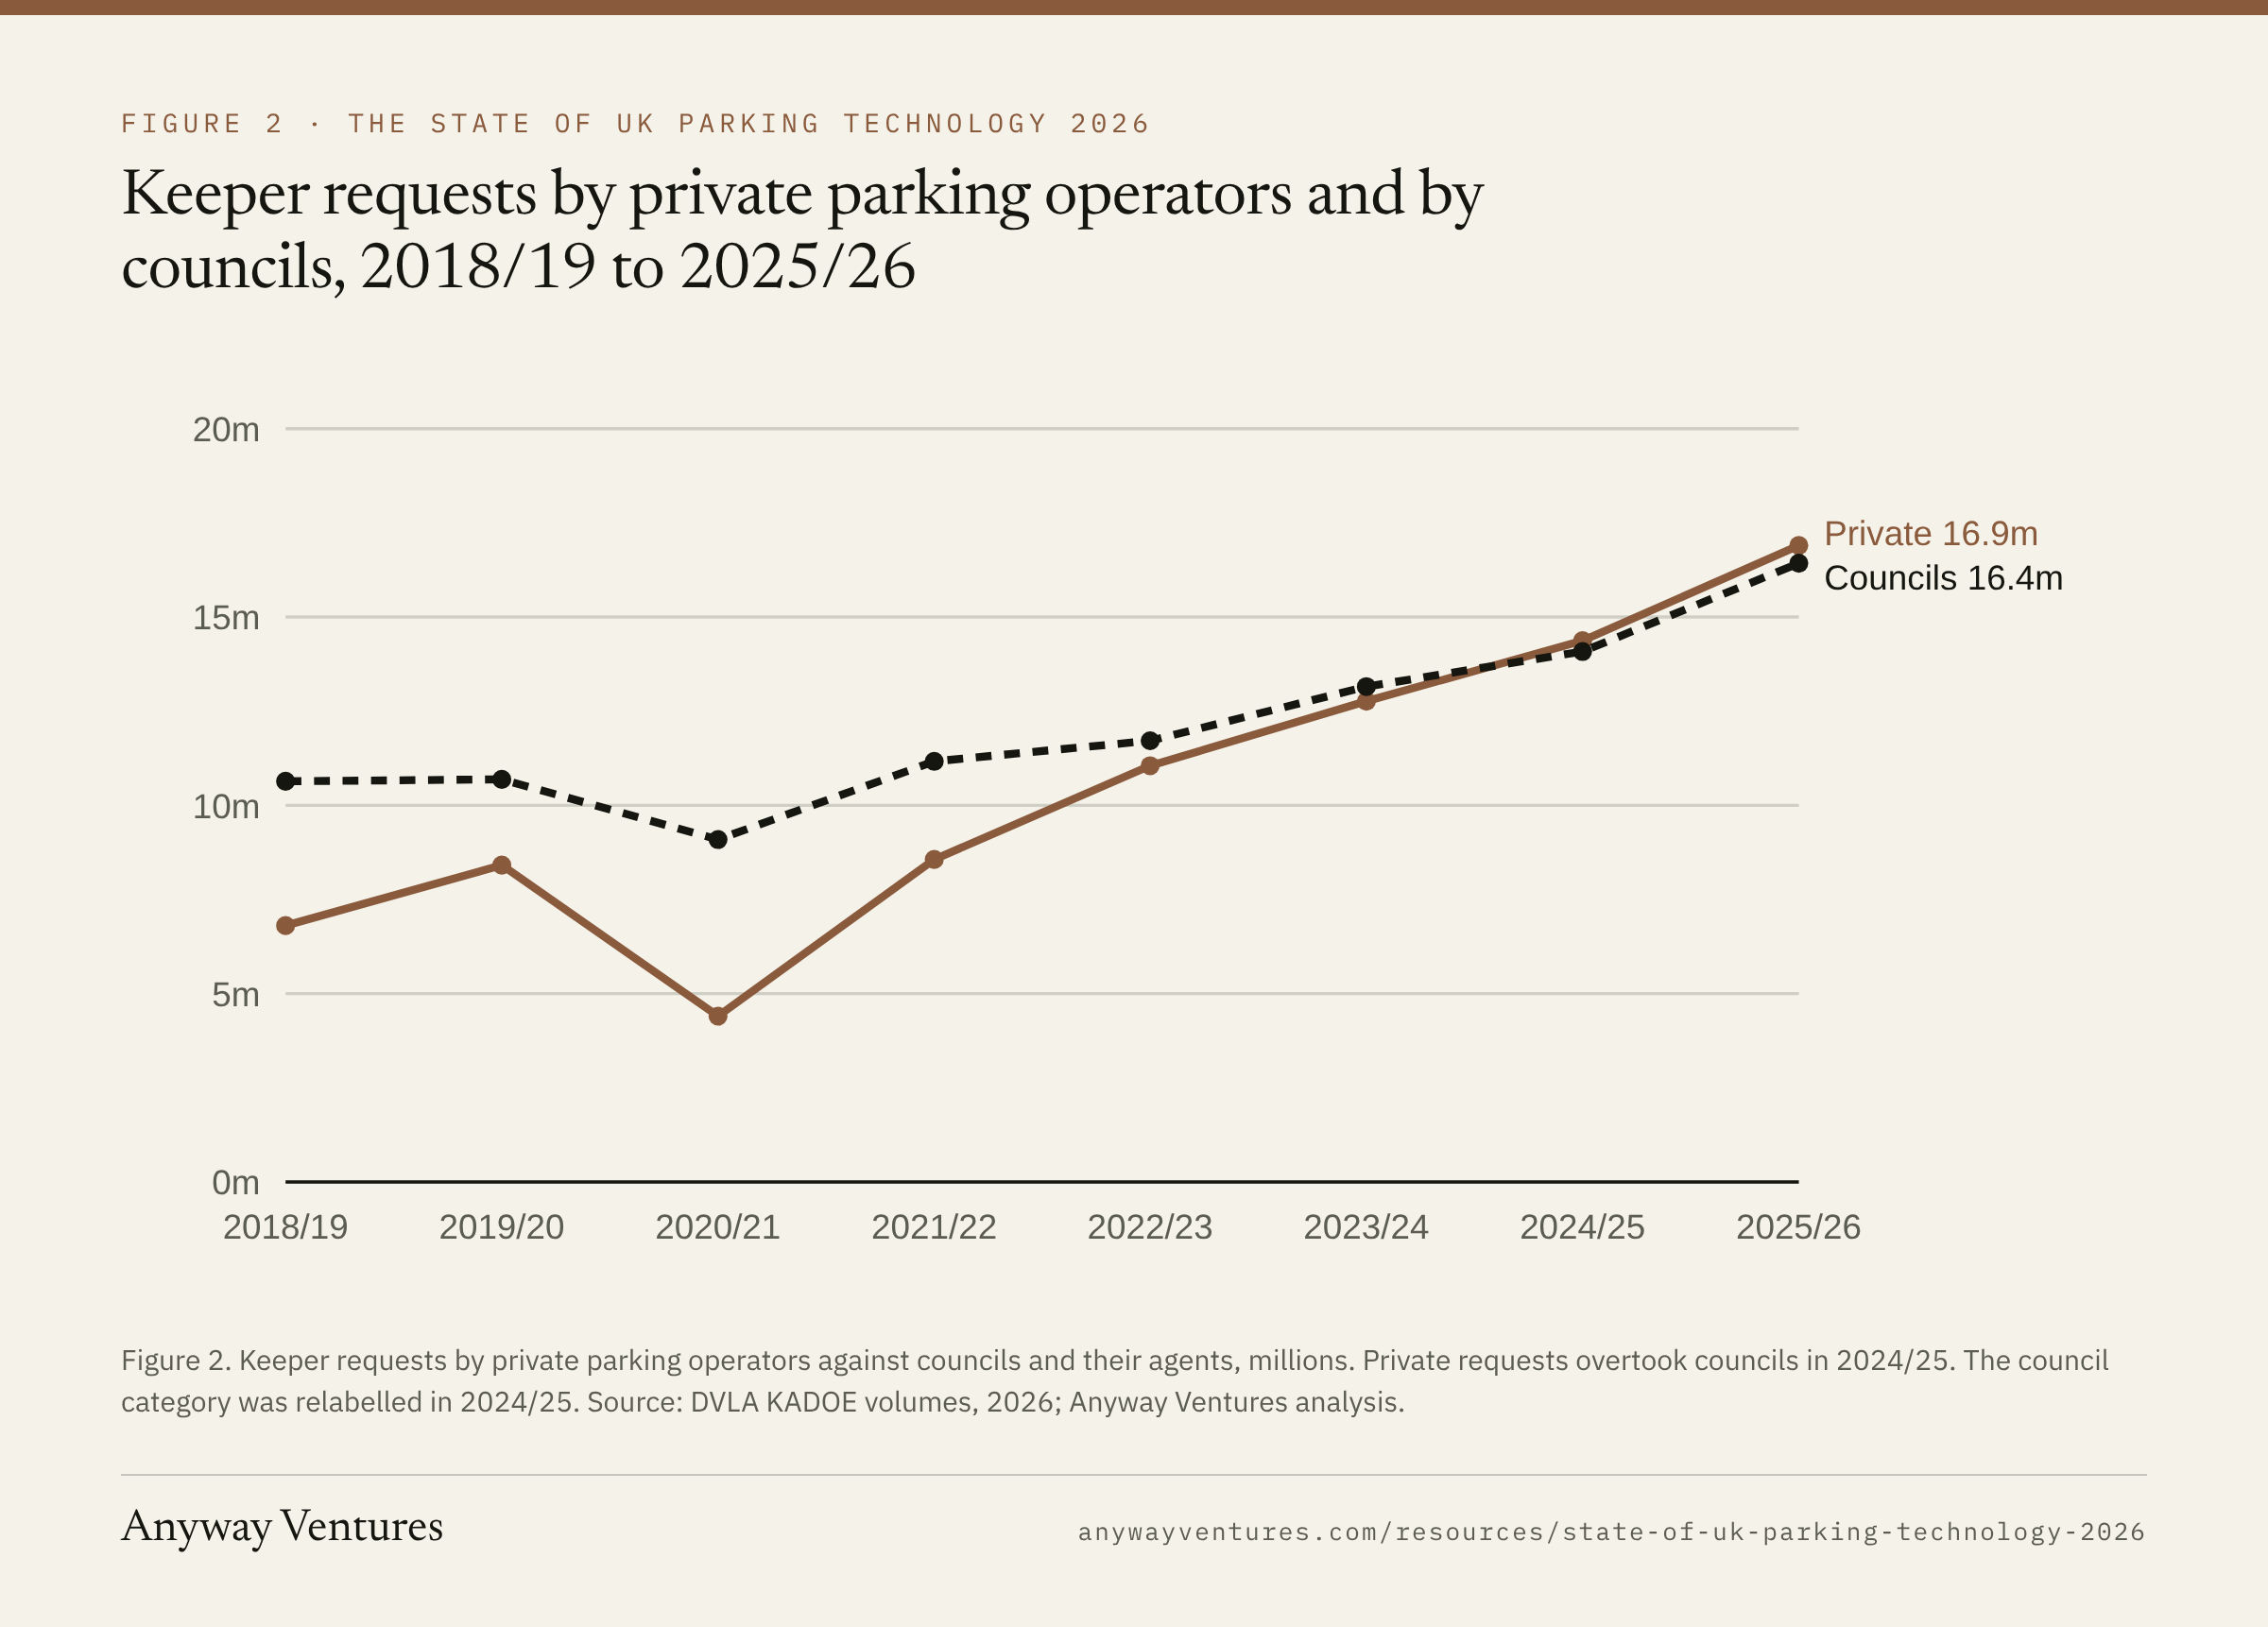
- Private operators now ask the DVLA for more keeper data than councils do. In 2024/25, for the first time in the DVLA's published series, private parking requests (14.37 million) overtook those from local authorities and their agents (14.09 million), and stayed ahead in 2025/26 (16.90 million against 16.42 million). Council requests grew at 6.4% a year over the period; private requests at more than twice that rate.
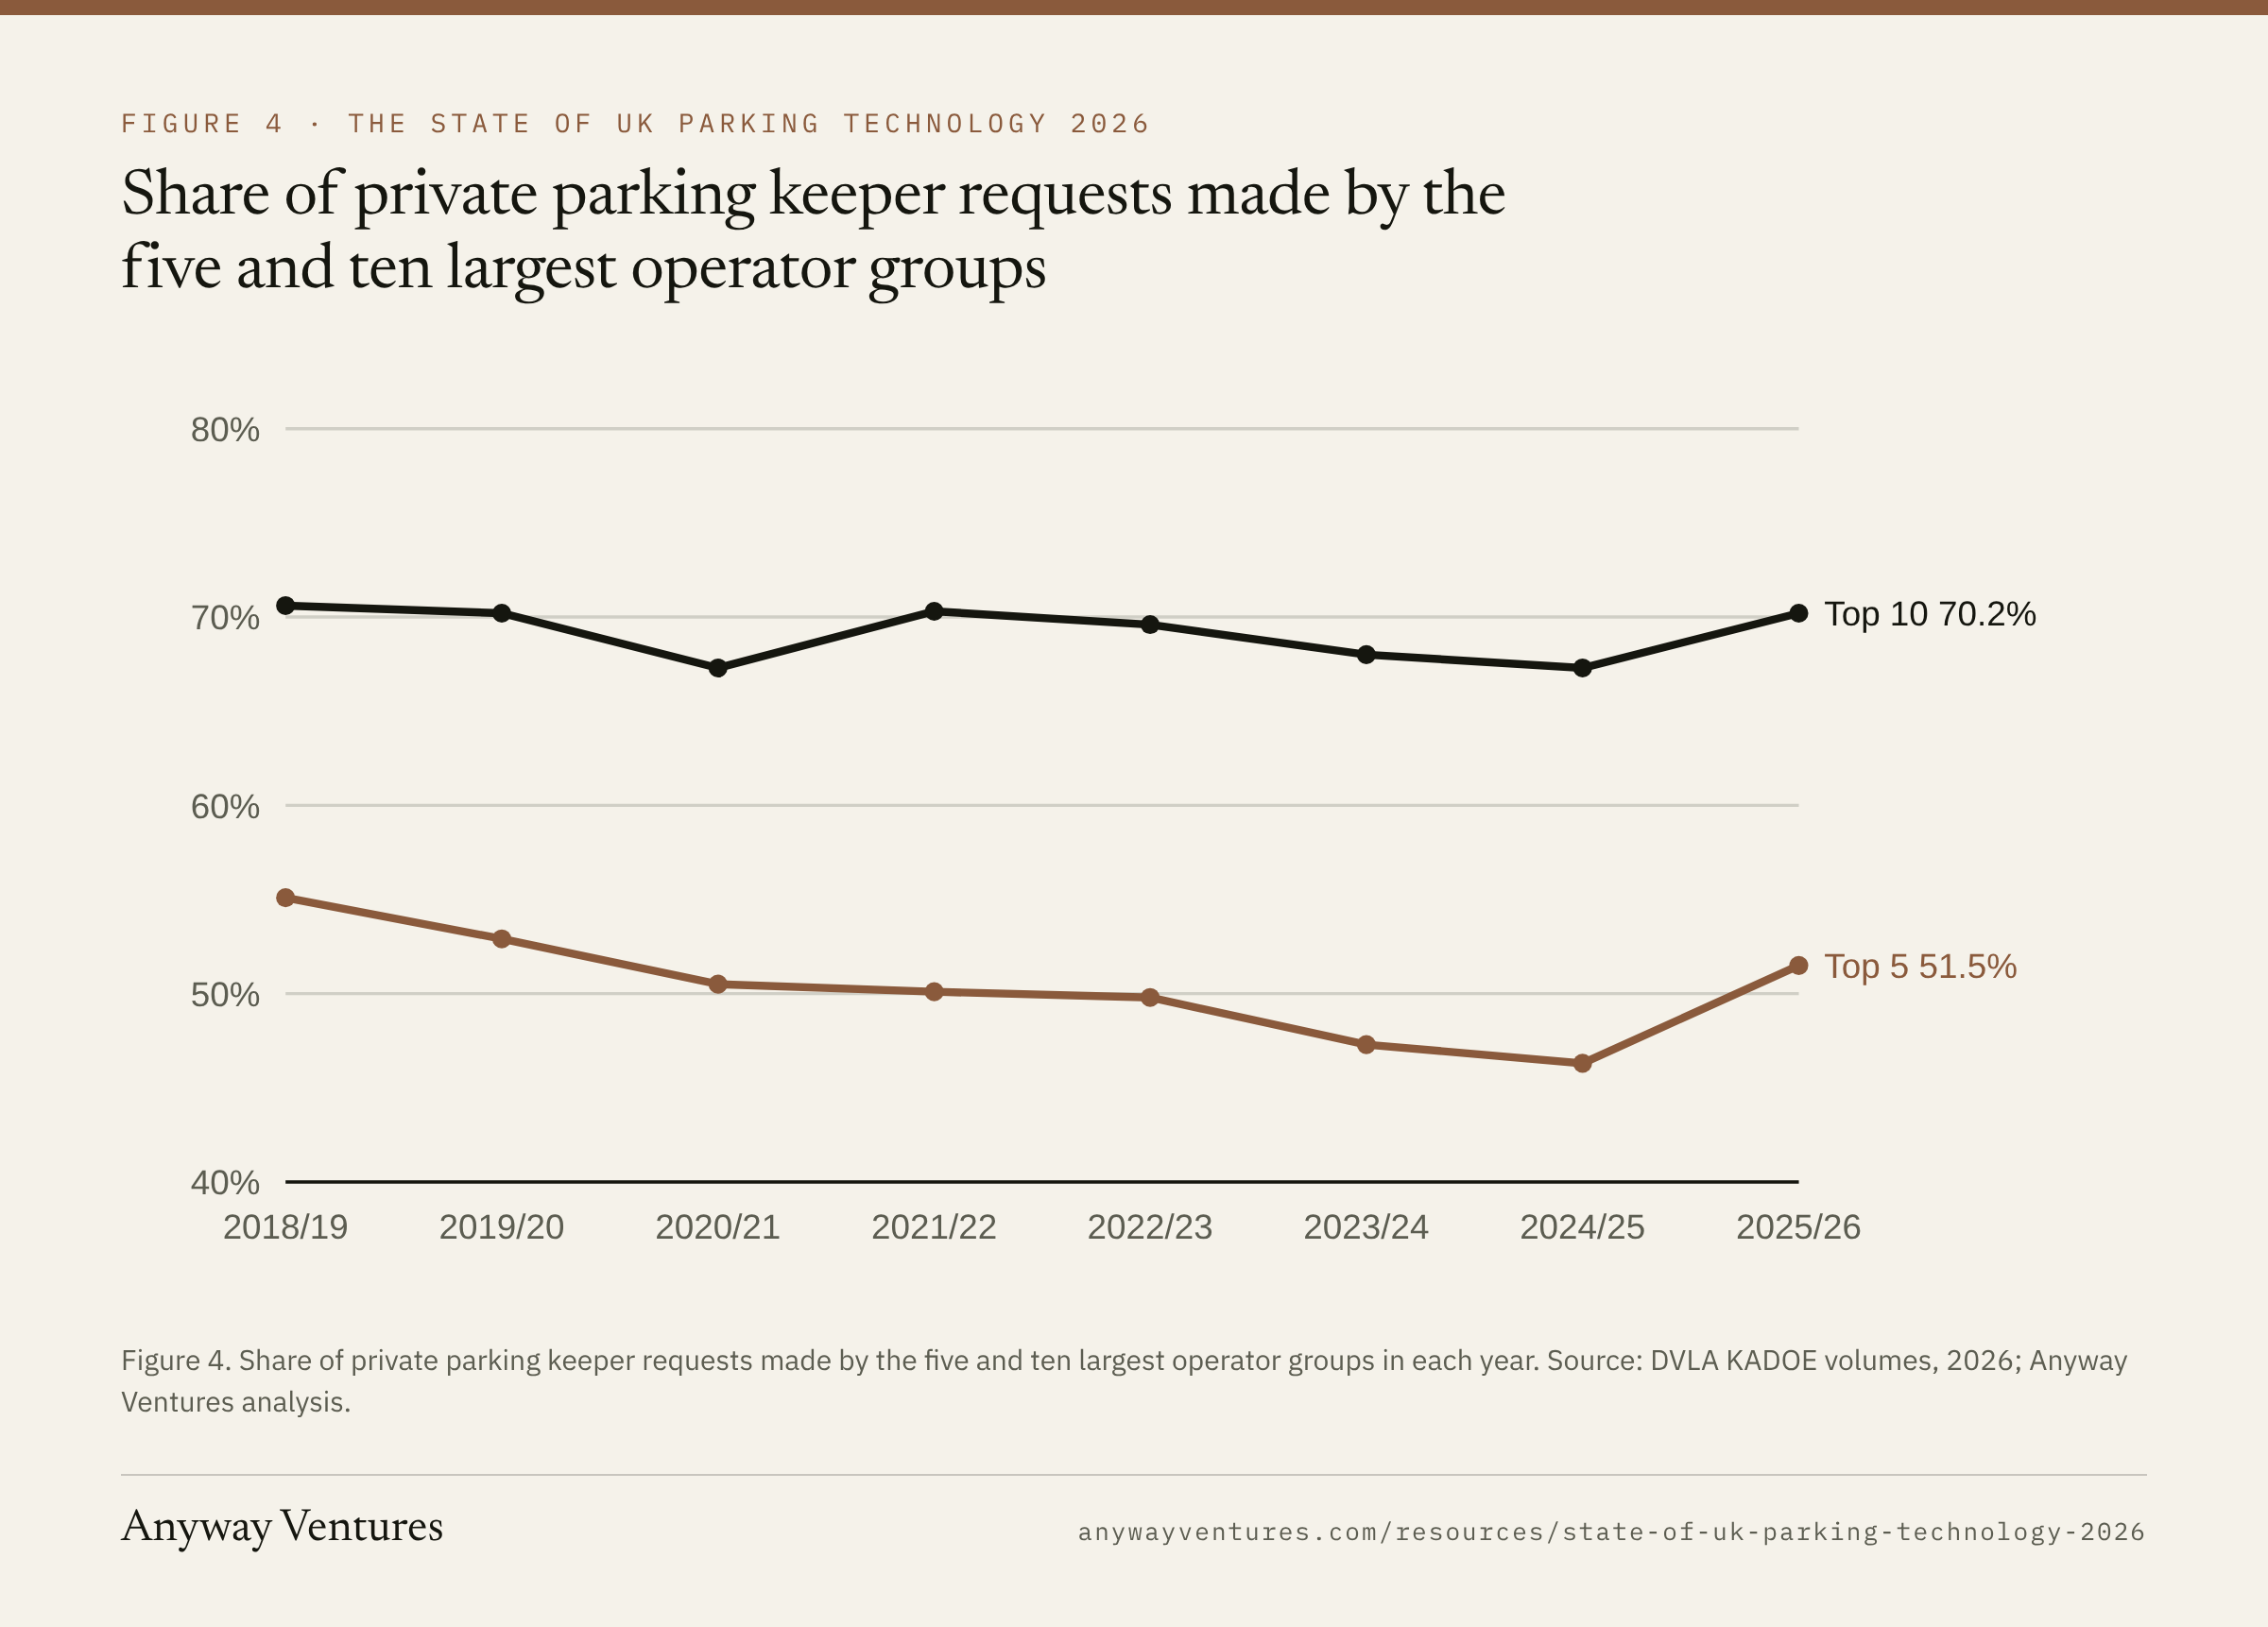
- Concentration has turned. The top five operator groups' share of requests fell every year from 55.1% in 2018/19 to 46.3% in 2024/25, then jumped to 51.5% in 2025/26, mostly because APCOA's requests rose 135% to 2.26 million. The three largest groups made 6.81 million requests in 2025/26: the same number as the entire industry in 2018/19.
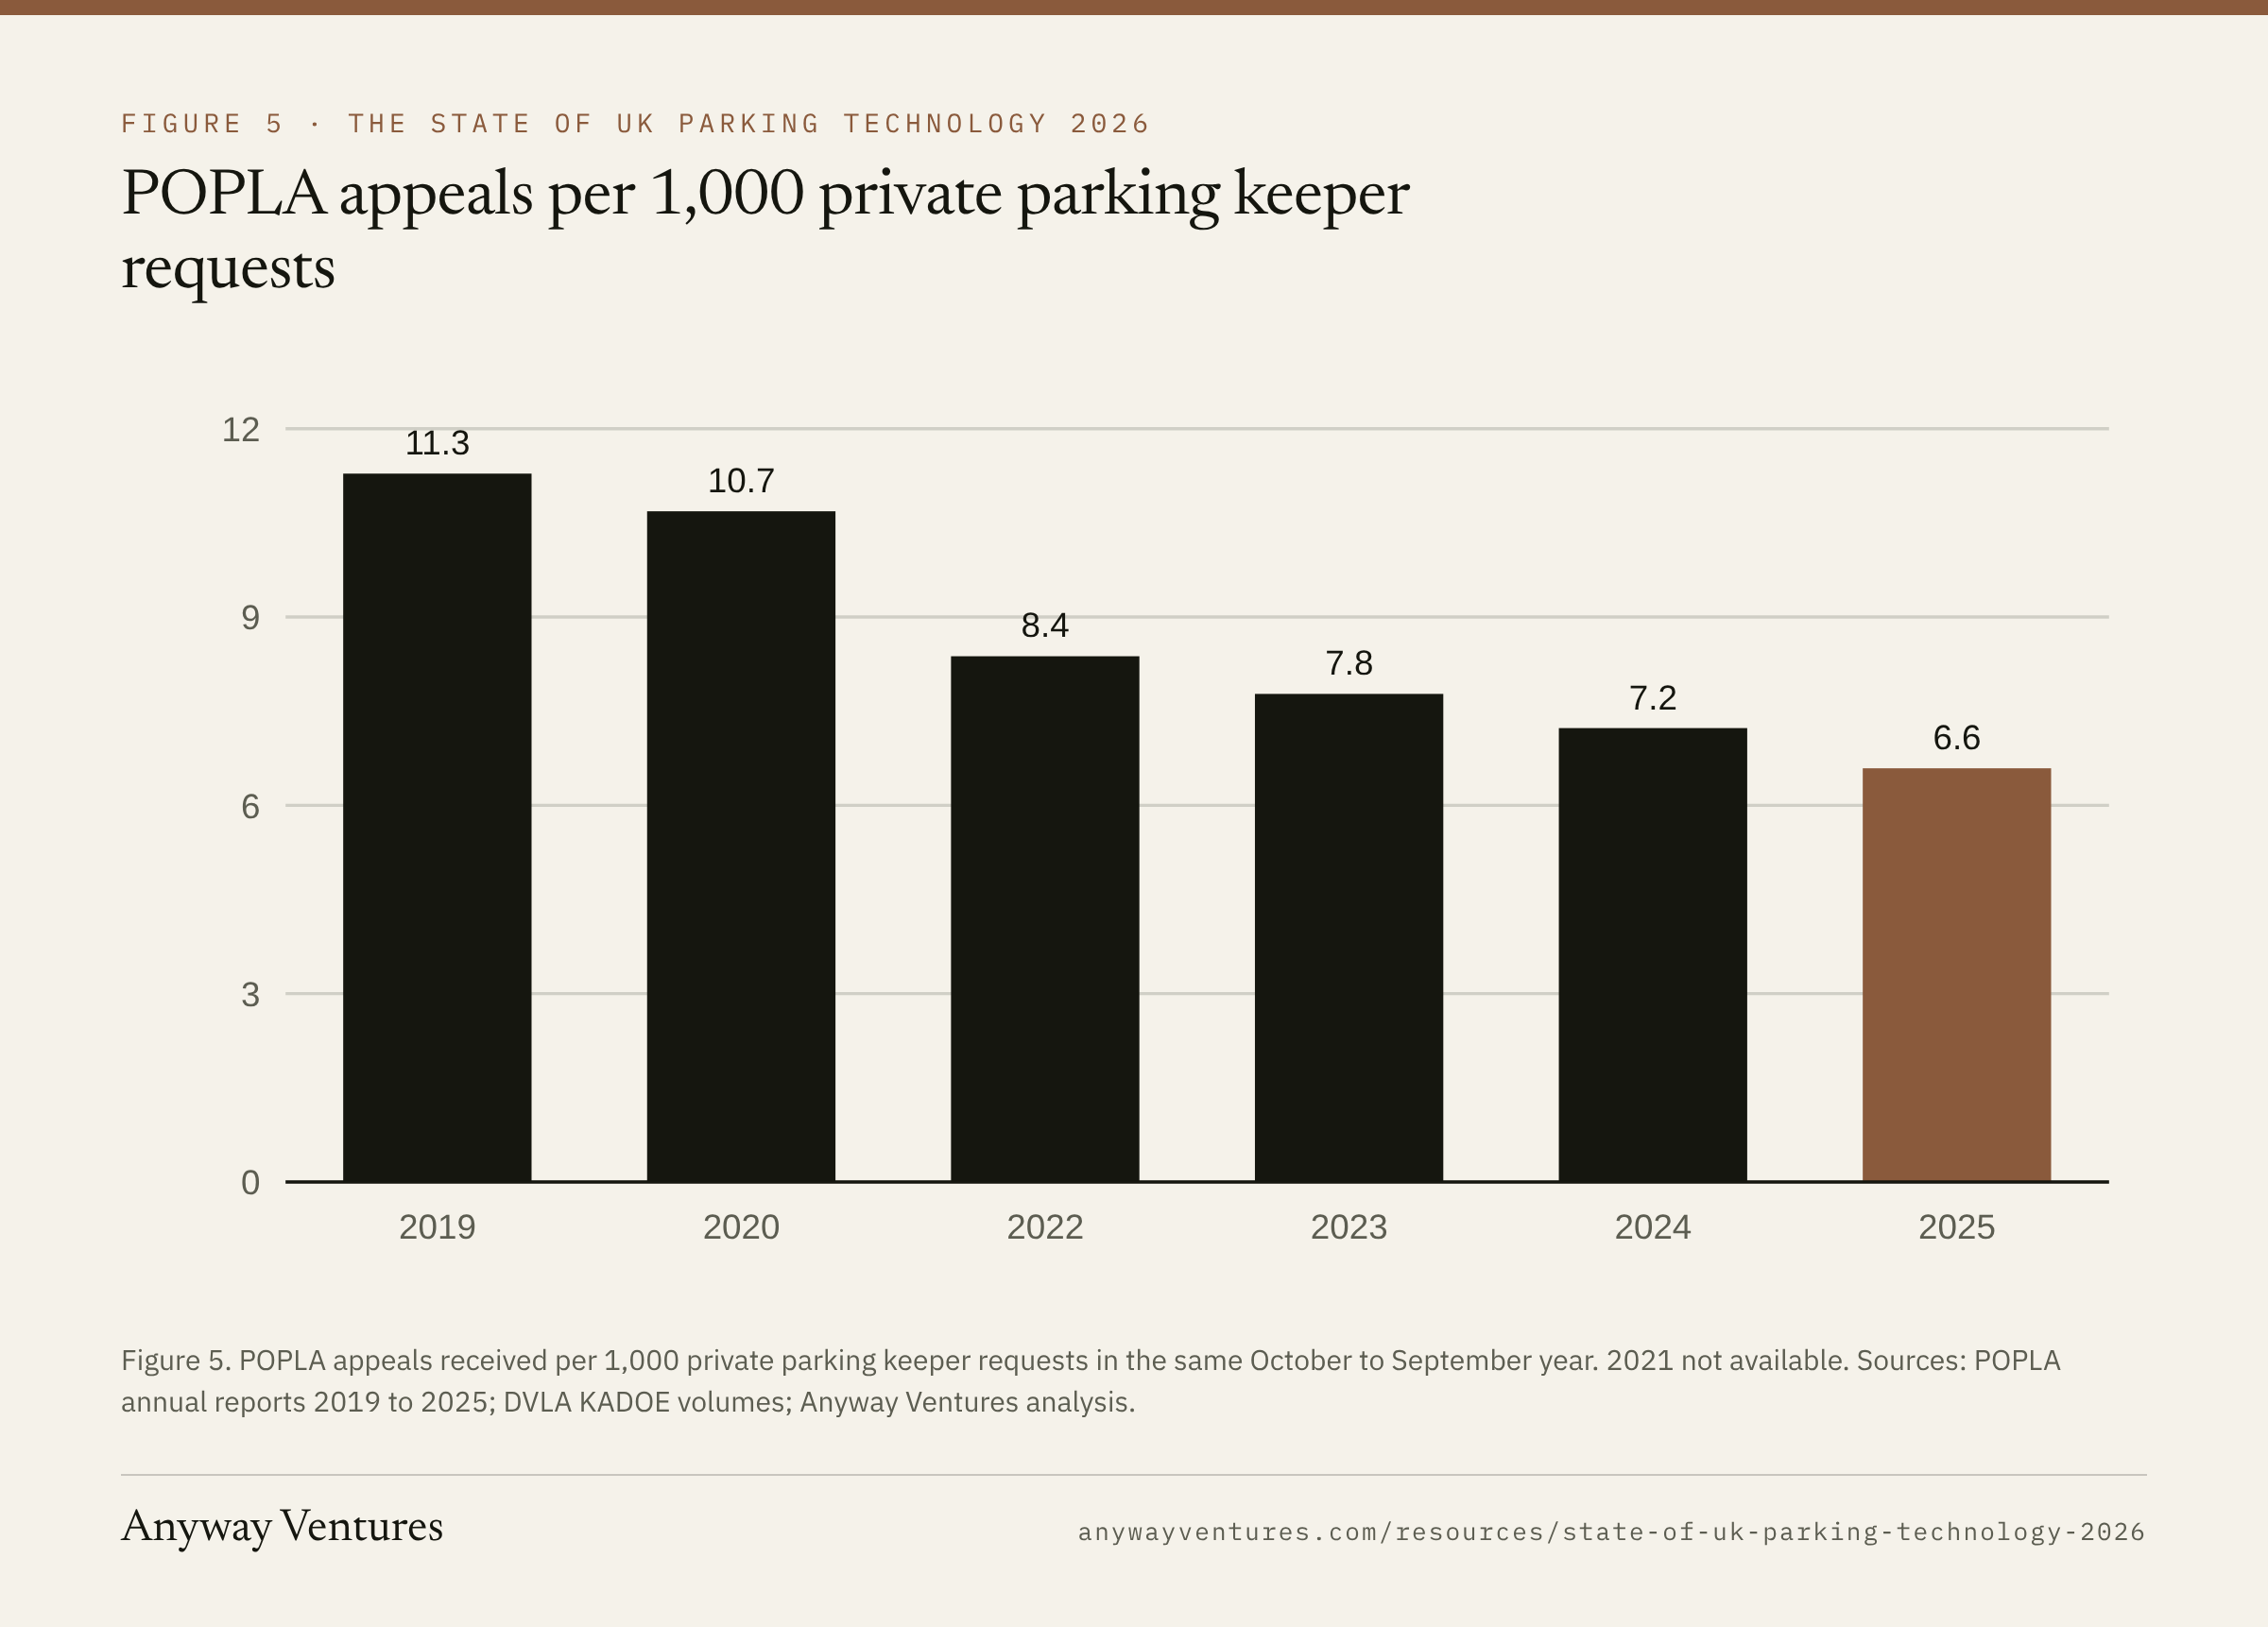
- Appeals are not keeping pace with charges. POPLA appeals per 1,000 keeper requests fell from 11.3 in 2019 to 6.6 in 2025. Adding the IAS gives 8.8 per 1,000, which matches the government's own 0.90% second-stage appeal rate. When an appeal does reach POPLA, it ends with the charge cancelled 46% of the time.
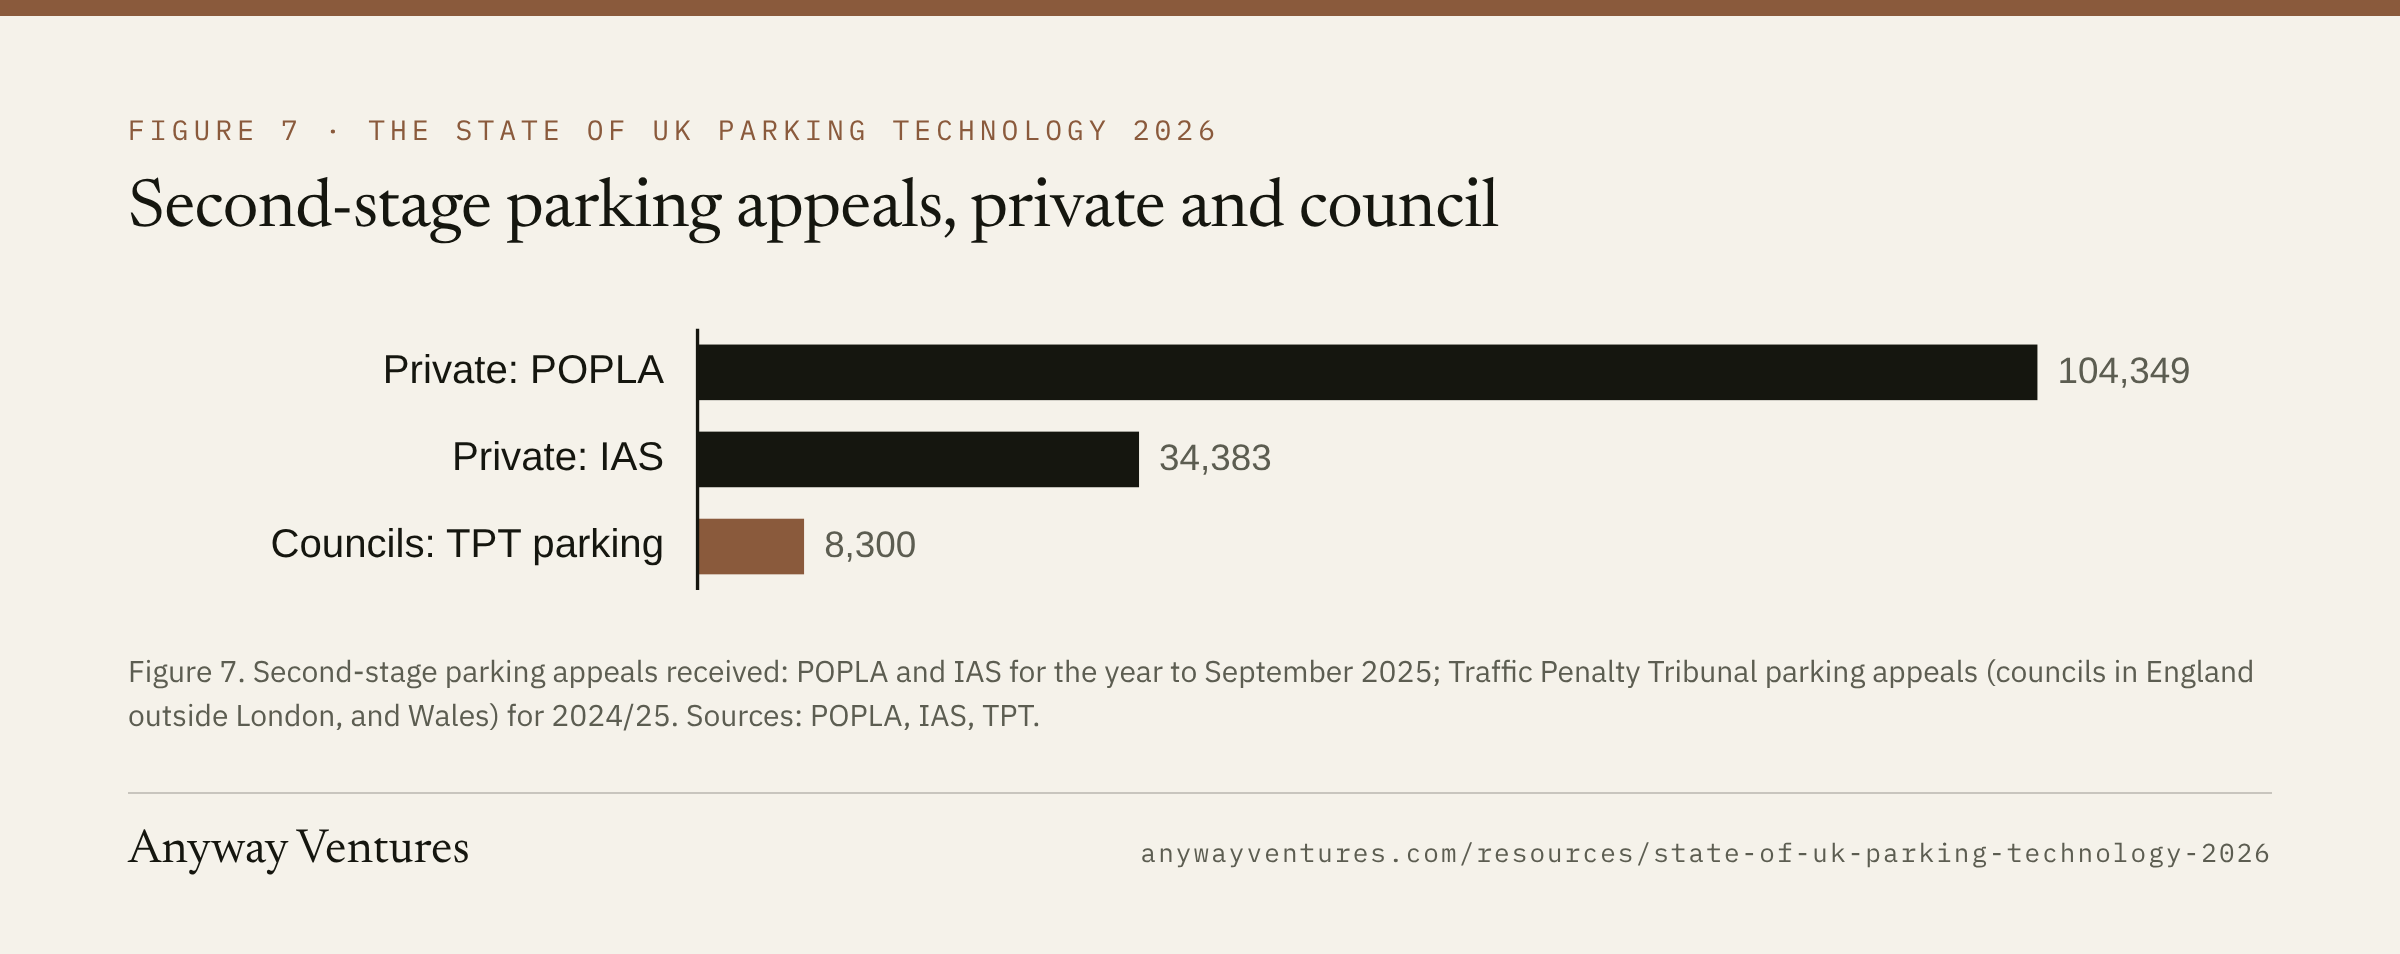
- Private parking generates 17 times as many independent appeals as council parking outside London. POPLA and the IAS received about 138,700 second-stage appeals in the year to September 2025. The Traffic Penalty Tribunal, which hears council parking appeals in England outside London and in Wales, received 8,300 in 2024/25.
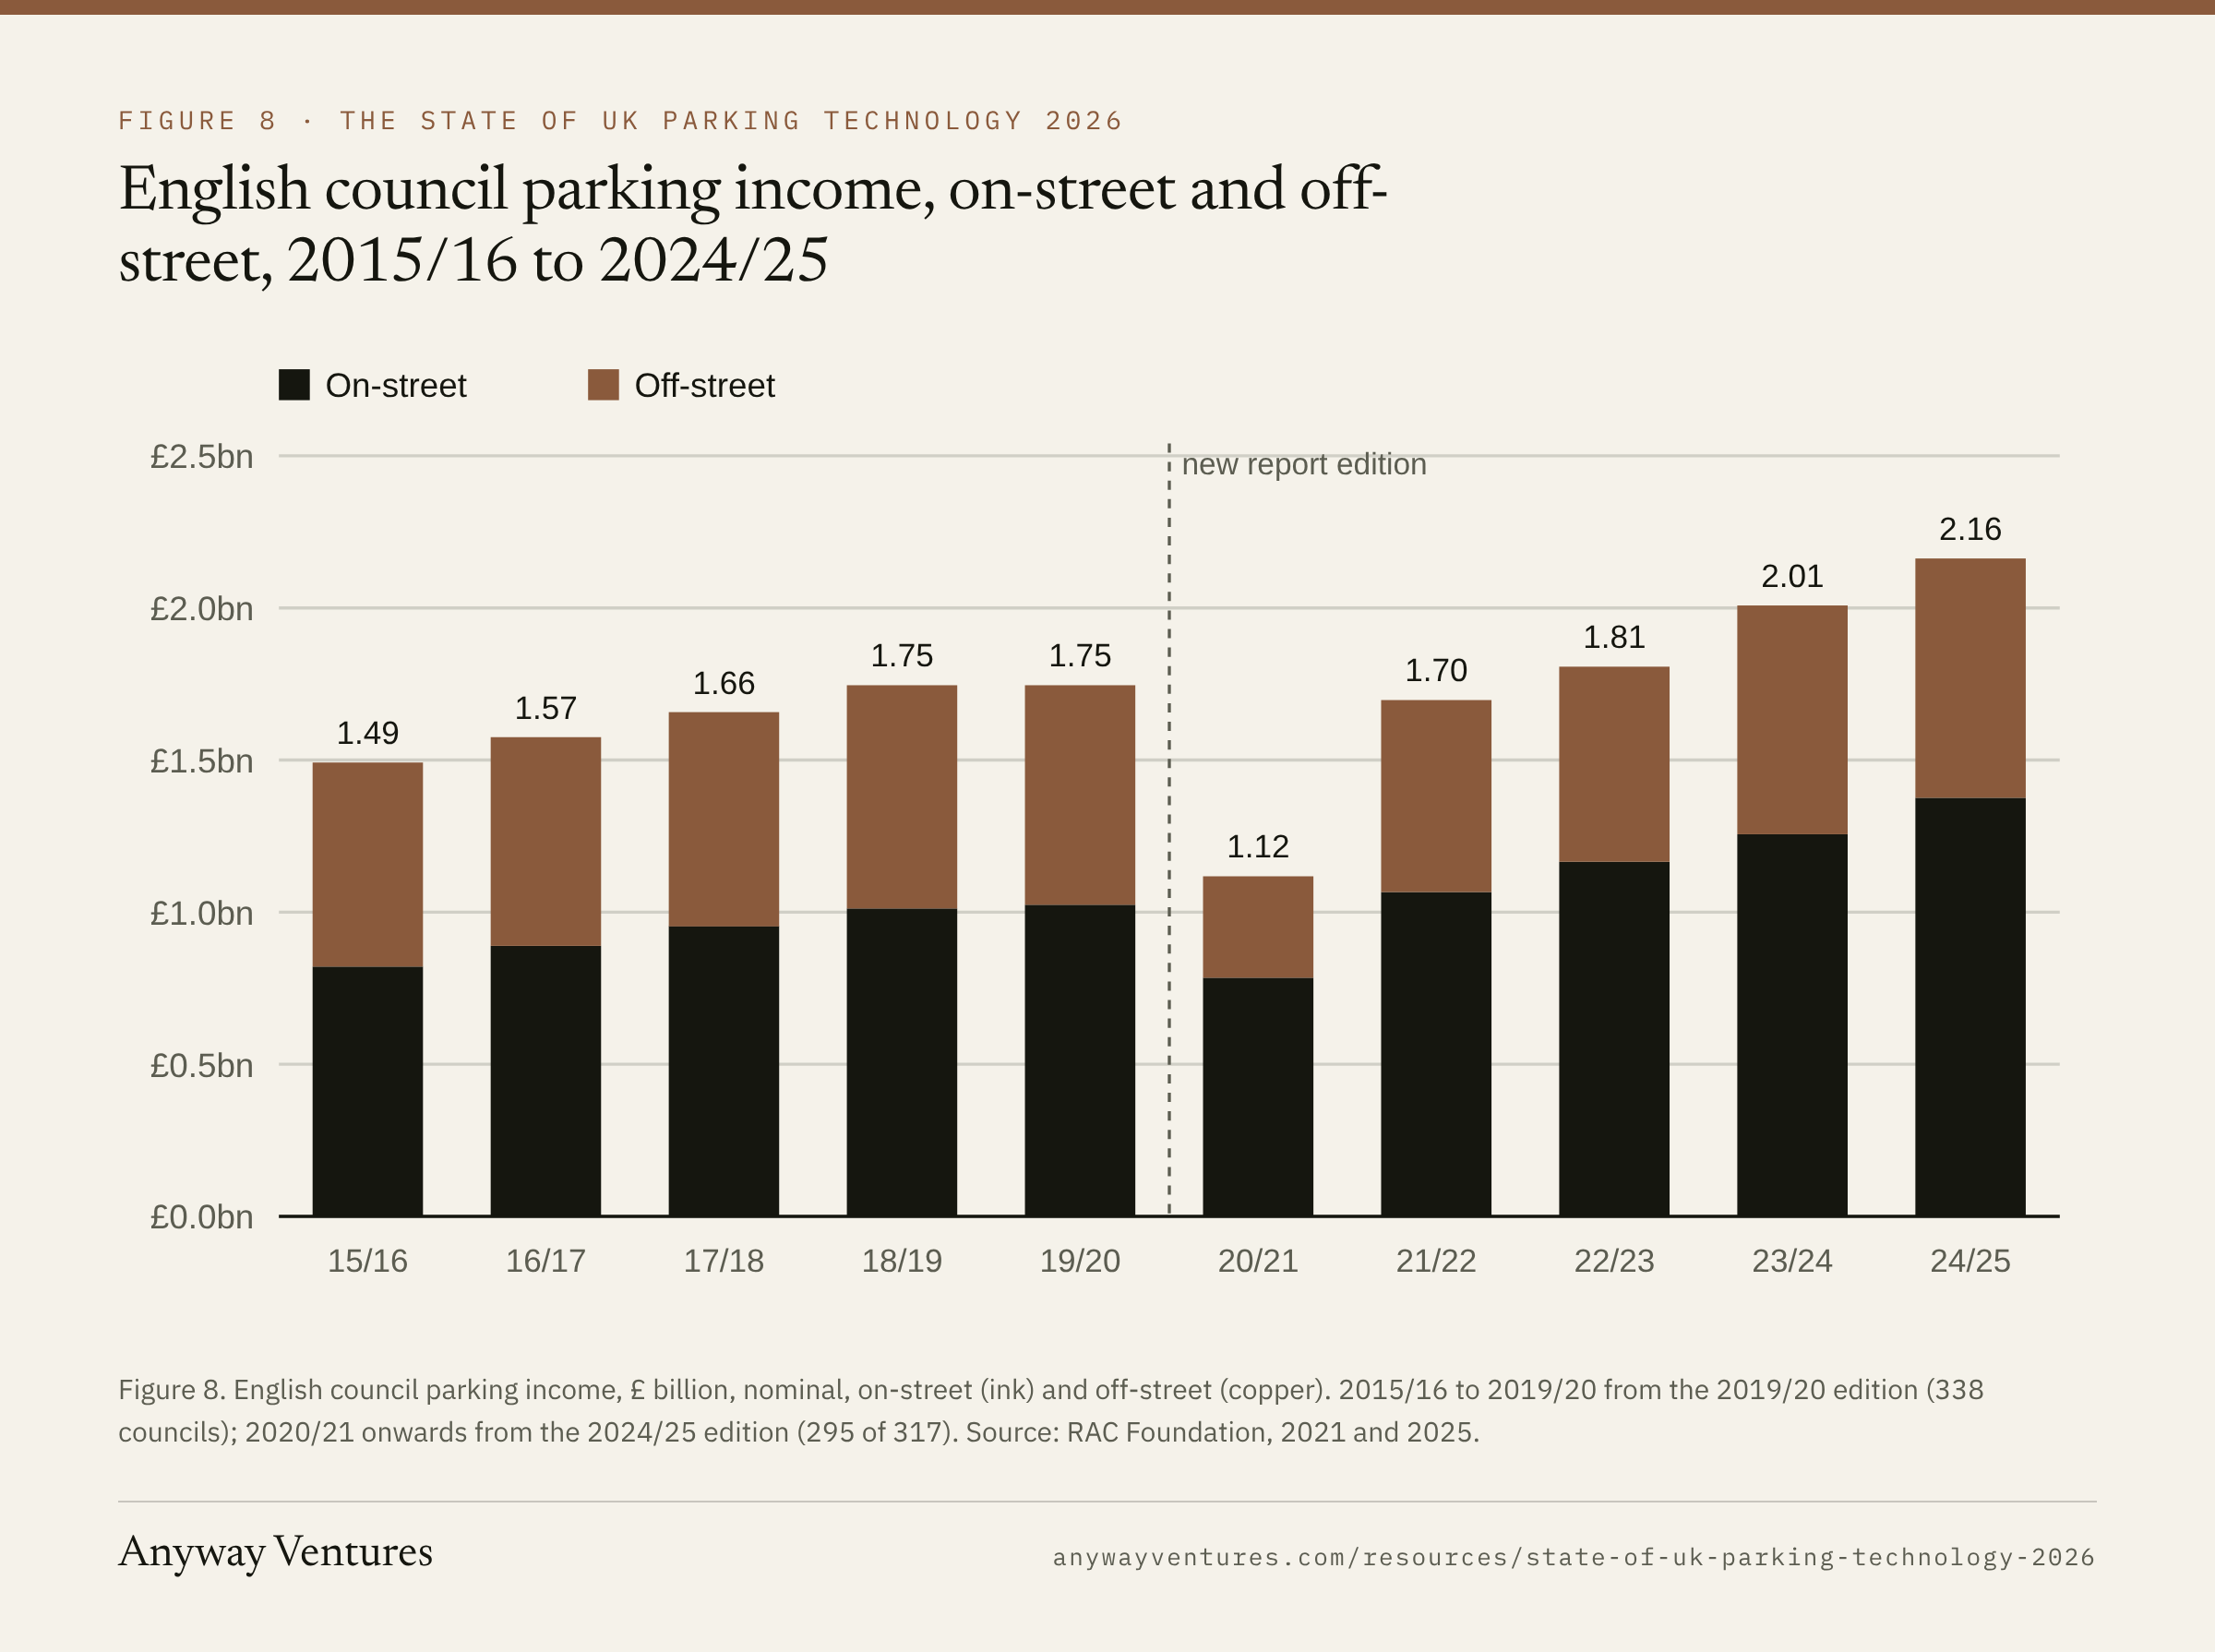
- Council parking is two businesses moving in opposite directions. English councils made a £1.094 billion surplus on £2.163 billion of income in 2024/25, a 51% margin, with London taking 55% of the surplus. Against 2019/20, on-street income is up 8% to 9% in real terms, but off-street car park income is down 2% to 12% in real terms, depending on which edition of the data is used. Kerbside enforcement has recovered; car parks have not.
- The 2026 code is a £327.5 million event on the government's numbers, and an unknown one on the evidence. The final stage impact assessment's net cost to business rests almost entirely on an illustrative 5% fall in charges (range 1% to 9%). It estimates 4.79 billion private parking events a year, 4.46 million spaces and ANPR coverage of about 80%, rising four points a year. Keeping the discount at 40% rather than 50% avoided a further £269 million.
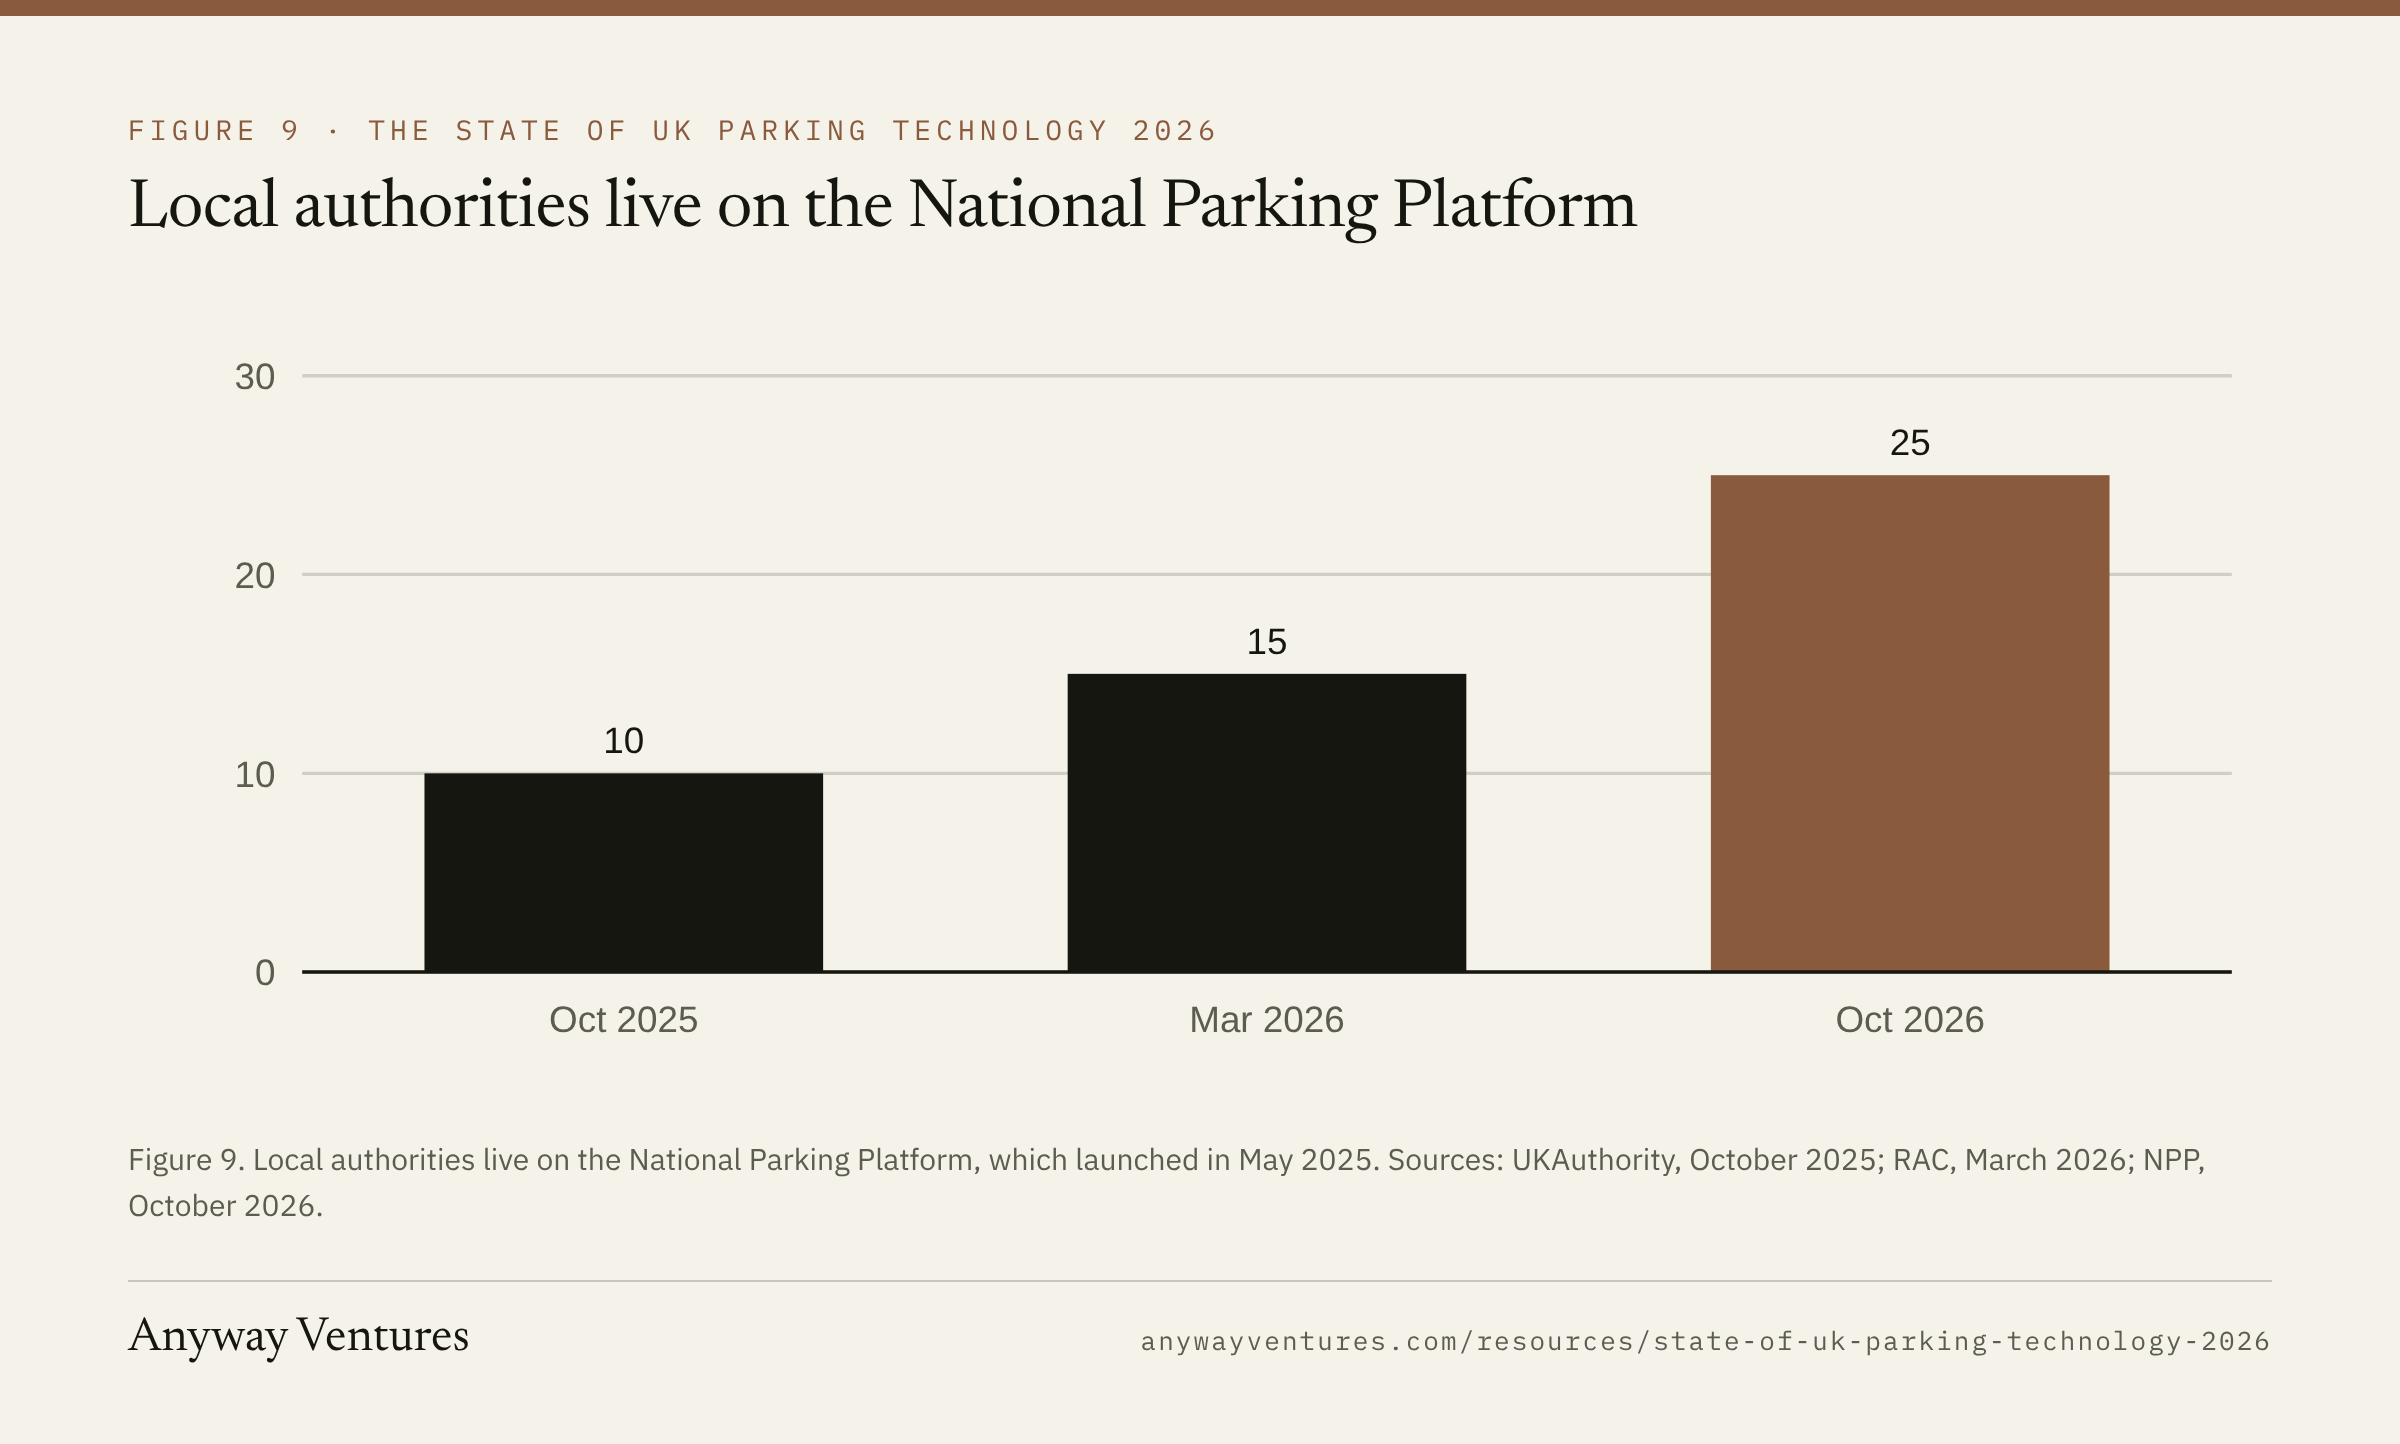
- Cash is a minority habit, but app-only parking is still a bad experience. Cash was 8% of UK payments in 2025 (UK Finance). Yet 73% of drivers who paid for parking by app in the previous year had difficulties (RAC). The National Parking Platform, which lets any connected app sell council parking, went from about 10 live councils in October 2025 to 25 in October 2026, covering 1,890 locations.
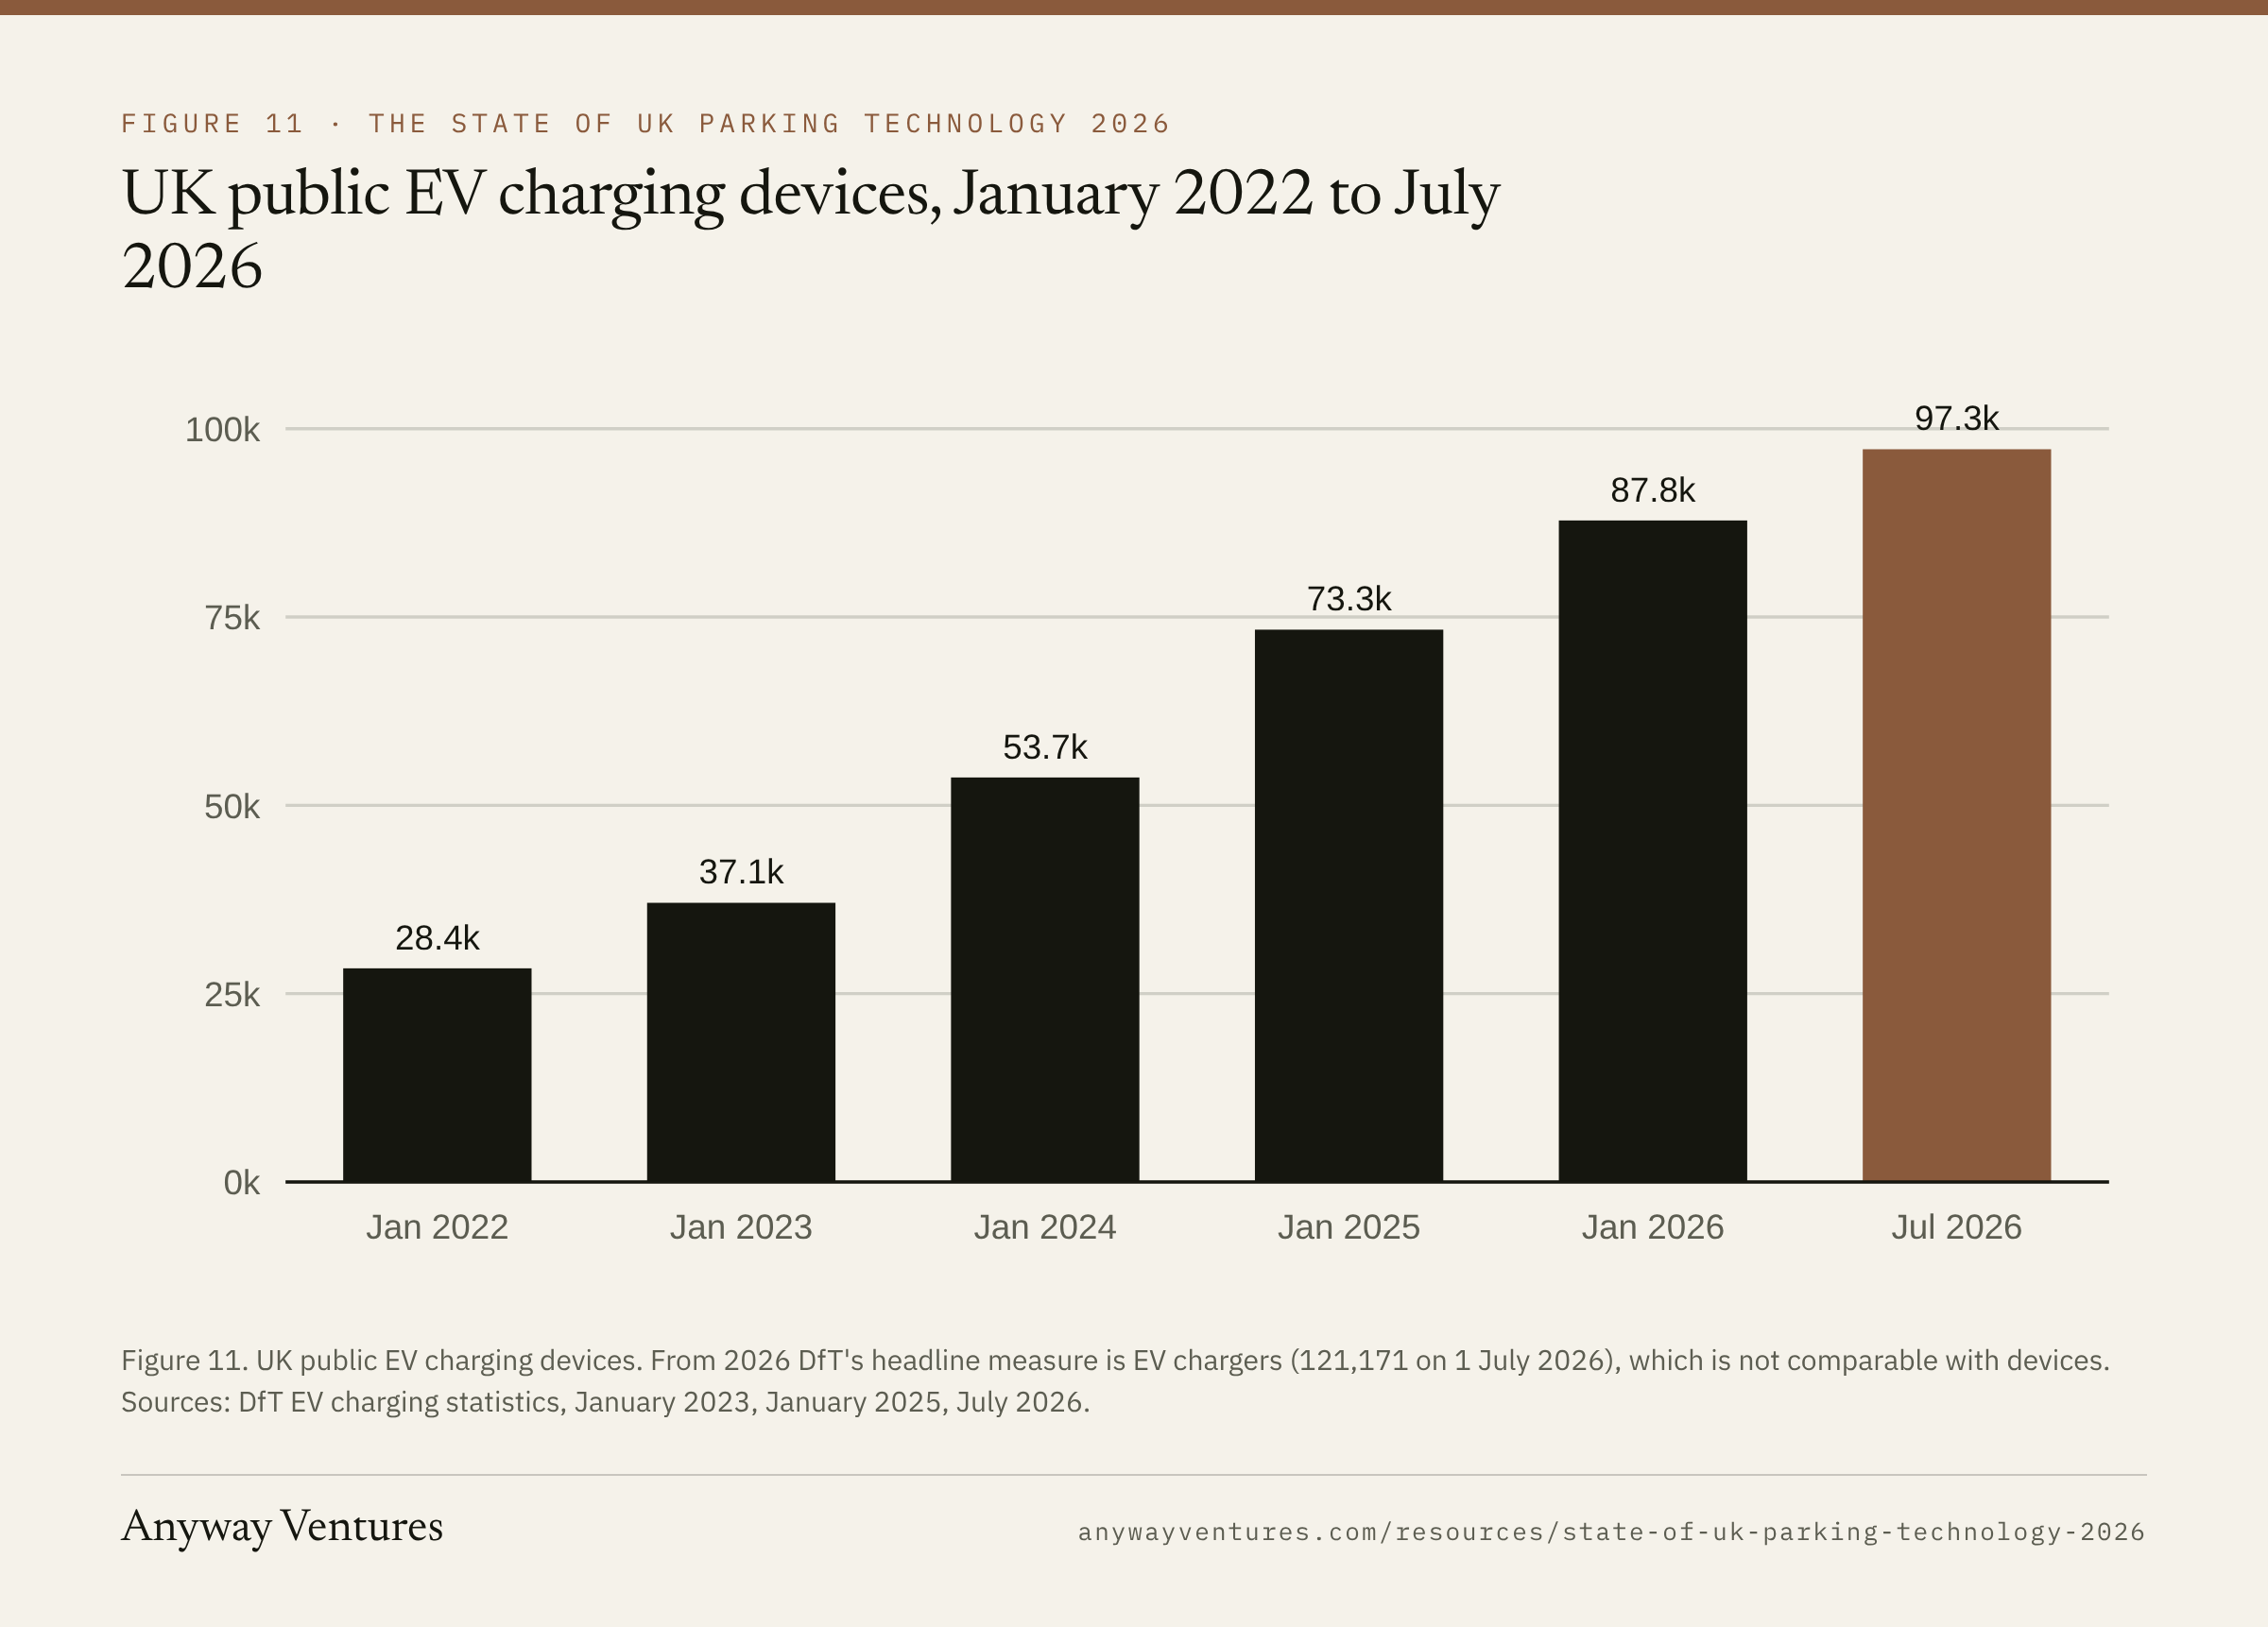
- Charging is now a car park business. The UK had 121,171 public EV chargers on 1 July 2026, 52% of them classed as destination chargers, the category that includes car parks. Public charging devices grew 3.4 times between January 2022 and July 2026.
- Consolidation is real, but prices are invisible. We verified 16 UK parking transactions and corporate events from 2019 to 2026. Only two disclosed a price. Arrive now owns seven brands across terminals, apps, marketplaces and in-car payment, and the collapse of NCP into administration in March 2026 was a lease failure, not a technology one. The most important industry numbers (charges issued, cashless share, ANPR read rates, AI use) are not published at all.
2. Methodology and sources
What we did. We started from primary datasets wherever they exist and rebuilt the numbers ourselves rather than relying on press summaries. The central dataset is the DVLA's KADOE workbook, which lists every organisation that requested registered keeper details through the Keeper at Date of Event service, by month, for each financial year from 2018/19 to 2025/26. We converted it, summed it and grouped it. We then lined it up against appeals data from POPLA, the IAS and the Traffic Penalty Tribunal, council finance data from the RAC Foundation and Transport Scotland, the government's final stage impact assessment for the 2026 code, payments data from UK Finance and the RAC, DfT charging statistics, and company and deal announcements.
How we defined private parking keeper requests. Rows in the DVLA workbook where the service type is "KADOE Fee" and the business is "Car Parking Management". Our totals match the published RAC and RAC Foundation series exactly (6.8 million in 2018/19, 16.9 million in 2025/26), which is a useful check that the method is the same one others use.
How we grouped operators. The DVLA lists links, not companies. Some businesses appear more than once: NCP has two links, CP Plus appears under its own name, as GroupNexus and through Ranger Services, and Smart Parking appears as "Smart Parking Ltd T/A Local Parking Security Ltd" after it bought LPS in March 2024. We combined links that are plainly the same business. We did not combine separate companies under common ownership, so Britannia Parking is shown separately from Q-Park, which bought it in June 2024. Concentration figures would be slightly higher if we did.
How we aligned appeals with keeper requests. POPLA and the IAS report on a year ending 30 September. The DVLA reports by financial year but publishes monthly figures, so we summed keeper requests for the same October to September window. The resulting ratio includes IPC members' requests in the denominator, whose appeals go to the IAS rather than POPLA, so read POPLA-only ratios as a trend.
How we treated council finances. The RAC Foundation's series is calculated only from councils that have reported, and the number reporting changes. We used the 2019/20 edition for 2015/16 to 2019/20 and the 2024/25 edition for 2020/21 onwards, and show the break. For real-terms comparisons we deflated by the ONS CPI index averaged over each financial year, which rose 24.5% between 2019/20 and 2024/25.
What we didn't do. We did not estimate figures that are not published, such as total charges issued, the cashless share of parking payments or deal multiples. Where a number is our arithmetic on someone else's data, we say so. Where sources disagree, we show both.
Caveat that matters most. A DVLA keeper request is not a parking charge. A windscreen ticket paid early never needs one; a vehicle can be requested more than once; and from 2020/21 the DVLA notes that its volumes count enquiries, not releases of keeper data. Keeper requests are the best public proxy for private parking enforcement, and nothing more.
All data was accessed in October 2026. Each tab of the Excel appendix carries its sources, the date accessed and notes. Readers who want the practitioner view of how to diligence a parking business should read our parking sector guide alongside this report.
3. The market in numbers
There is no official measure of the size of UK parking, and the government says so. Its impact assessment for the 2026 code assembles the best available estimates, mostly from industry data, and they are the nearest thing to a census the private sector has.
| Measure | Figure | Source |
|---|---|---|
| Private parking spaces | 4.46 million (estimate) | MHCLG impact assessment, 2026, from a BPA figure of 3.7 million |
| Private parking events a year | 4.79 billion (estimate) | MHCLG impact assessment, from BPA data that 99.7% of events don't result in a charge |
| ANPR coverage of private parking | About 80%, rising about 4 points a year | MHCLG impact assessment, from the 2023 Call for Evidence |
| Growth in ANPR-managed sites, 2018 to 2022 | 80% | BPA data in the MHCLG impact assessment |
| Private parking keeper requests, 2025/26 | 16,900,805 | DVLA KADOE volumes, 2026 |
| Organisations requesting keeper data for parking | 203 KADOE links, 192 operator groups | DVLA; our grouping |
| Signs in BPA and IPC car parks | 1.3 million | MHCLG impact assessment |
| English council parking income, 2024/25 | £2.163 billion | RAC Foundation, 2025 |
| English council parking surplus, 2024/25 | £1.094 billion | RAC Foundation, 2025 |
| Scottish DPE authority parking income, 2024/25 | £133.7 million across 23 authorities | Our sum of Transport Scotland, 2026 |
| Public EV chargers, 1 July 2026 | 121,171 | DfT, 2026 |
| Live councils on the National Parking Platform | 25, with 1,890 locations | NPP, October 2026 |
| Cash share of all UK payments, 2025 | 8% | UK Finance, 2026 |
Three ratios fall out of these figures. First, private parking produces about 3.5 keeper requests per 1,000 parking events (16.9 million over 4.79 billion), consistent with the BPA's statement that 99.7% of events end without a charge. Second, there are about 3.8 keeper requests a year for every private parking space. Third, the impact assessment values each 1% of parking charges at £64 million over ten years in present-value terms, which implies charge payments to operators of roughly £6.4 billion over a decade; that is our arithmetic from the government's figure, not a published total.
What the table doesn't contain is as telling. There is no official figure for private tariff income, pre-book spend, app revenue, the number of charges actually issued or the number of operators. The impact assessment estimates that small and micro firms are 70% to 91% of operators, and notes that the thirteenth largest operator by turnover in 2024 had a turnover of about £10 million and 47 employees.
One listed operator offers a useful window. Smart Parking's FY26 results report 1,525 UK sites, 779,960 UK parking breach notices in the year to June 2026 (up 4%), UK revenue of A$84.9 million (up 62%) and adjusted UK EBITDA of A$25.9 million, a 30.5% margin. The company estimates the UK market at 45,000 ANPR sites. Its UK revenue works out at about A$109 per breach notice (our arithmetic), and the 62% revenue growth on 4% more notices came largely from changes to debt resolution, which the company says added A$7.0 million of EBITDA. Smart's 795,554 keeper requests in 2025/26 sit close to its 779,960 notices, which supports keeper requests as a working proxy for charges at an ANPR-heavy operator.
4. Enforcement and keeper data
Eight years of keeper requests
| Financial year | Private parking requests | Growth | Council requests | Private as % of council |
|---|---|---|---|---|
| 2018/19 | 6,808,344 | 10,637,570 | 64% | |
| 2019/20 | 8,411,897 | +23.6% | 10,687,913 | 79% |
| 2020/21 | 4,399,936 | -47.7% | 9,091,708 | 48% |
| 2021/22 | 8,564,762 | +94.7% | 11,169,317 | 77% |
| 2022/23 | 11,052,986 | +29.1% | 11,716,942 | 94% |
| 2023/24 | 12,768,101 | +15.5% | 13,151,905 | 97% |
| 2024/25 | 14,371,841 | +12.6% | 14,087,292 | 102% |
| 2025/26 | 16,900,805 | +17.6% | 16,424,820 | 103% |
Source: DVLA KADOE volumes, 2026; Anyway Ventures analysis. Council requests are KADOE Non-Fee requests by local authorities and, from 2024/25, their agents; they include bus lane, moving traffic and Clean Air Zone enforcement.
The shape is a straight line interrupted by a pandemic. Requests fell 48% in 2020/21, recovered to their pre-Covid level in 2021/22, and have grown every year since. The growth slowed to 12.6% in 2024/25 and then accelerated again to 17.6% in 2025/26, the year in which the Sector Single Code's transition period was running and the statutory code was being finalised. The monthly data shows no slowdown into the code: July 2025 was the highest month in the series at 1,567,262 requests, and March 2026 was 21% above March 2025.
The government's own projection assumes the growth continues. The impact assessment notes post-Covid growth has averaged 15% a year, links it mainly to ANPR adoption, and models 15% growth until 2028, tapering to zero by 2032/33 as ANPR coverage approaches 100%. If that is right, the industry is still four or five years from the end of its conversion boom.
Private enforcement has overtaken council enforcement in keeper data
This is, as far as we can find, the first time anyone has set the two series side by side. In 2018/19 private operators made 64 keeper requests for every 100 made by councils. By 2024/25 they made 102. Councils still issue far more penalties than this implies, because most council parking PCNs are served on the windscreen by a civil enforcement officer and never need a keeper request; camera enforcement of most parking contraventions on council land is restricted by section 53 of the Deregulation Act 2015. But for postal enforcement, the private sector is now the DVLA's largest customer.
Why it matters. The DVLA's keeper data is the input that makes ANPR enforcement work. A private sector that draws on it more heavily than local government does will be regulated more like a public function, which is the direction of the 2026 code, the CMA's July 2026 action and the GIAA audits.
Who makes the requests
| Operator group | 2018/19 | 2024/25 | 2025/26 | Share 2025/26 | Growth in 2025/26 |
|---|---|---|---|---|---|
| ParkingEye | 1,855,907 | 2,300,360 | 2,523,467 | 14.9% | +9.7% |
| APCOA | 109,027 | 960,482 | 2,259,861 | 13.4% | +135.3% |
| Euro Car Parks | 672,359 | 1,733,493 | 2,025,358 | 12.0% | +16.8% |
| Horizon Parking | 176,962 | 875,833 | 1,107,790 | 6.6% | +26.5% |
| Smart Parking | 391,048 | 784,464 | 795,554 | 4.7% | +1.4% |
| NCP | 252,635 | 714,876 | 723,750 | 4.3% | +1.2% |
| Civil Enforcement | 373,831 | 688,585 | 645,762 | 3.8% | -6.2% |
| CP Plus (GroupNexus) | 196,740 | 509,732 | 645,127 | 3.8% | +26.6% |
| UK Parking Control | 163,224 | 579,806 | 601,265 | 3.6% | +3.7% |
| Parkmaven | 0 | 519,481 | 528,327 | 3.1% | +1.7% |
| UK Car Park Management | 187,637 | 444,678 | 501,515 | 3.0% | +12.8% |
| Britannia Parking | 189,044 | 370,712 | 385,959 | 2.3% | +4.1% |
| All other groups | 2,239,930 | 3,889,339 | 4,157,070 | 24.6% | +6.9% |
| Total | 6,808,344 | 14,371,841 | 16,900,805 | 100% | +17.6% |
Source: DVLA KADOE volumes; Anyway Ventures grouping. Full series for 16 groups in the appendix.
Four things stand out. ParkingEye has been the largest requester in every year, but its share has almost halved, from 27.3% in 2018/19 to 14.9%, because the rest of the industry has grown faster. APCOA went from a minor requester (109,027 in 2018/19) to the second largest in the country; the DVLA data does not explain its 2025/26 jump and we have not assumed a reason. Parkmaven did not appear in the data before 2021/22 and made more than half a million requests by 2024/25, the fastest rise of any group. And NCP made 723,750 requests in 2025/26, the year it went into administration, which says something about how separate enforcement income is from the property economics of a leasehold estate.
Concentration has stopped falling
| Financial year | Operator groups | Top 5 share | Top 10 share | HHI | Groups under 50,000 requests |
|---|---|---|---|---|---|
| 2018/19 | 118 | 55.1% | 70.6% | 1,031 | 96 (11.6% of requests) |
| 2019/20 | 131 | 52.9% | 70.2% | 983 | 108 (10.0%) |
| 2020/21 | 145 | 50.5% | 67.3% | 800 | 128 (20.7%) |
| 2021/22 | 171 | 50.1% | 70.3% | 797 | 147 (14.1%) |
| 2022/23 | 177 | 49.8% | 69.6% | 734 | 149 (11.6%) |
| 2023/24 | 182 | 47.3% | 68.0% | 690 | 152 (11.3%) |
| 2024/25 | 177 | 46.3% | 67.3% | 637 | 143 (9.9%) |
| 2025/26 | 192 | 51.5% | 70.2% | 709 | 157 (8.8%) |
Source: DVLA KADOE volumes; Anyway Ventures analysis. HHI is the sum of squared percentage shares across all groups.
For six years the number of requesters rose and the leaders' share fell: new entrants and mid-sized ANPR operators grew faster than the incumbents. In 2025/26 that reversed. The top five's share rose five points in a single year and the long tail (157 groups making fewer than 50,000 requests each) fell to 8.8% of volume, the lowest in the series. By the conventional reading, an HHI of 709 is still an unconcentrated market, and keeper requests measure enforcement activity rather than revenue or sites. But the direction has changed, and the impact assessment expects the code to push it further: it says reduced viability for smaller firms "will likely mean that either a market exit or acquisition is the likely next step".
A discrepancy we couldn't reconcile. The impact assessment cites BPA analysis that the five largest operators made "around 55%" of keeper requests in 2023. Our figure for 2023/24 is 47.3%. The BPA may use a calendar year, its own members only or different groupings. Anyone quoting a concentration figure should say which.
DVLA audits
The DVLA audits users of keeper data through the Government Internal Audit Agency. An RAC analysis of FOI data, published on 19 October 2026, found that of 90 operators audited in 2024/25, 36 (40%) were rated red, 11 (12%) amber and 43 (48%) green. The RAC named G24, UK Car Park Management and Vehicle Control Services as rated red in four of their five audits, and APCOA as red in each of its three audits (2020, 2022 and 2024/25). The ratings are point-in-time judgements and the audits test process (lawful basis, retention, security, evidence, ANPR controls, access, complaints and processors), not outcomes. There is no published year-by-year series by operator, so this cannot be turned into a trend; it is one of the gaps in section 13.
Put the two datasets together and the scale is clear. APCOA, the second largest requester in 2025/26, and UK Car Park Management, the eleventh, are both on the RAC's list of repeat red ratings, and between them they made 2.76 million requests, 16% of the total. A red rating has not, on this evidence, constrained volume.
Appeals: falling behind the charges
| Year to September | POPLA appeals received | Completed | Charge cancelled | Keeper requests, same 12 months | Appeals per 1,000 requests |
|---|---|---|---|---|---|
| 2019 | 89,609 | 79,962 | 40% | 7,940,536 | 11.3 |
| 2020 | 65,087 | 58,522 | 41% | 6,091,954 | 10.7 |
| 2022 | 85,474 | 76,292 | 45% | 10,205,956 | 8.4 |
| 2023 | 93,085 | 88,626 | 42% | 11,974,519 | 7.8 |
| 2024 | 98,110 | 92,098 | 40% | 13,570,321 | 7.2 |
| 2025 | 104,349 | 107,202 | 46% | 15,828,950 | 6.6 |
Sources: POPLA annual reports and releases for 2019, 2020, 2022, 2023, 2024 and the 2025 appendix; DVLA monthly KADOE data; Anyway Ventures analysis. Cancelled means allowed at adjudication or not contested by the operator. 2021 is not shown because we could not verify a total.
POPLA, the appeals service for BPA members, received a record 104,349 appeals in the year to September 2025. Over the same twelve months private operators made 15.8 million keeper requests. Between 2019 and 2025, keeper requests in the POPLA year rose 99% and POPLA appeals rose 16%, so the ratio fell from 11.3 to 6.6 appeals per 1,000 requests. POPLA covers BPA members only, and some of the growth in requests comes from IPC members whose appeals go to the Independent Appeals Service. Adding the IAS's 34,383 disputes for the same year gives 138,732 second-stage appeals, or 8.8 per 1,000 keeper requests. That is almost exactly the 0.90% second-stage appeal rate the government uses in its impact assessment, a useful sign that the two datasets describe the same system.
Three readings are possible, and the data can't separate them: charges have become better evidenced and less often worth appealing; more drivers pay at the 40% discount rather than risk the full charge; or the two-stage process deters appeals that would succeed. The impact assessment's BPA data says 21% of charges are appealed to the operator and 55% of those succeed, which is a large first-stage filter that nobody publishes by operator.
When a case does reach POPLA, the motorist often wins. In 2025, 21.5% of decided appeals were allowed and operators chose not to contest another 34,502, so 46% of resolved appeals ended with the charge cancelled. At the IAS, operators conceded 7,888 of 25,476 accepted cases (31%) before adjudication.
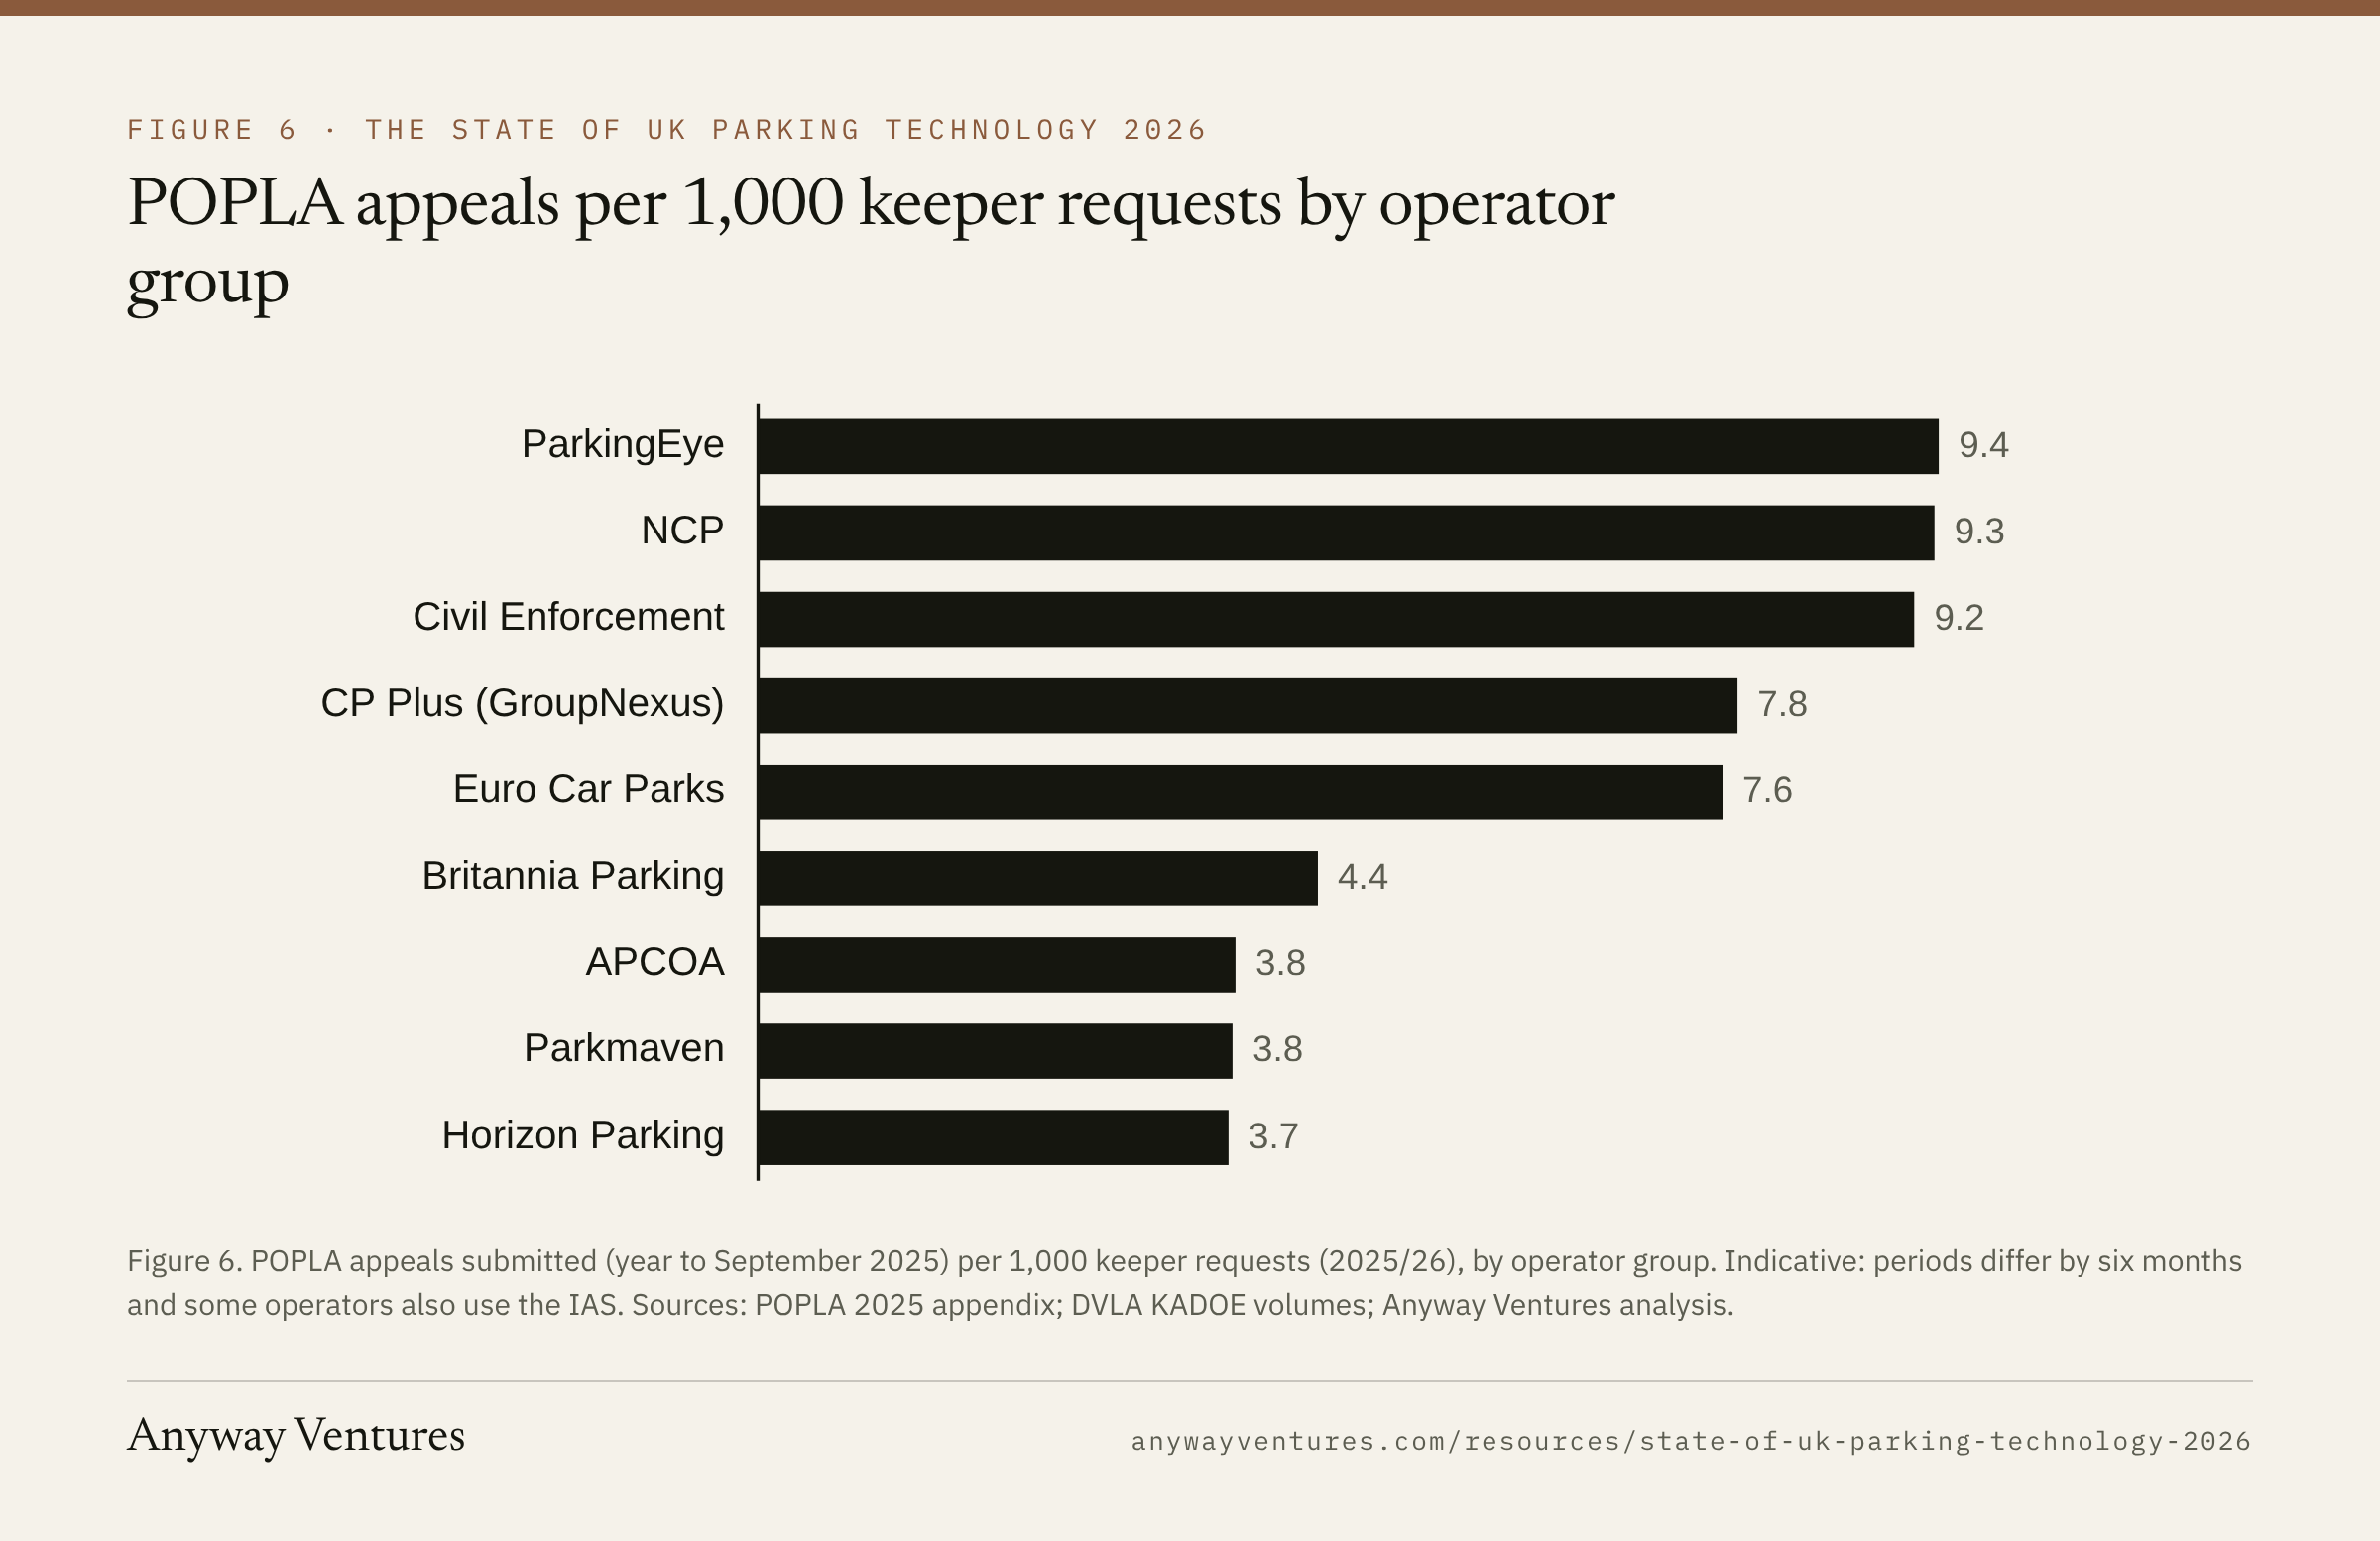
Appeals by operator
| Operator group | POPLA appeals | Allowed share of decided | Not contested share | POPLA appeals per 1,000 keeper requests |
|---|---|---|---|---|
| ParkingEye | 23,602 | 23% | 24% | 9.4 |
| NCP | 6,745 | 43% | 78% | 9.3 |
| Civil Enforcement | 5,914 | 17% | 29% | 9.2 |
| CP Plus (GroupNexus) | 5,005 | 15% | 23% | 7.8 |
| Euro Car Parks | 15,471 | 16% | 62% | 7.6 |
| Britannia Parking | 1,711 | 12% | 28% | 4.4 |
| APCOA | 8,547 | 13% | 47% | 3.8 |
| Parkmaven | 1,986 | 33% | 55% | 3.8 |
| Horizon Parking | 4,128 | 13% | 38% | 3.7 |
Sources: POPLA 2025 appendix, year to September 2025, summed across each group's England and Wales, Scotland and Northern Ireland entries; DVLA KADOE volumes, 2025/26; Anyway Ventures analysis. "Not contested" includes withdrawals by either party.
This is the first operator-level view we know of that sets appeals against enforcement volume. It is indicative: the periods are six months apart, and operators that use both associations have IAS appeals we can't see. Even so, the spread is wide. NCP and Euro Car Parks withdrew from most appeals rather than defend them; ParkingEye contested three quarters and was the largest single source of POPLA cases. Smart Parking is missing because its England and Wales total is absent from the appendix's submitted table.
Private and council appeals compared
Council parking appeals go to statutory tribunals. The Traffic Penalty Tribunal, which covers councils in England outside London and in Wales, received 8,300 parking appeals in 2024/25 (7,655 a year earlier) and allowed 3,363 of 7,482 decided, 1,892 of them because the council didn't contest. Private parking produced about 17 times as many second-stage appeals as council parking in the TPT's area. The comparison isn't exact (London's tribunal is excluded, and council tickets are mostly served on the windscreen), but the gap in scale is large, and it is one reason the government is building statutory oversight of private appeals.
5. Councils
England: a £1.1 billion surplus
| £ million, nominal | 2020/21 | 2021/22 | 2022/23 | 2023/24 | 2024/25 |
|---|---|---|---|---|---|
| On-street income | 785 | 1,066 | 1,166 | 1,256 | 1,376 |
| On-street costs | 452 | 499 | 515 | 557 | 631 |
| On-street surplus | 333 | 567 | 651 | 699 | 746 |
| Off-street income | 333 | 631 | 641 | 752 | 787 |
| Off-street costs | 346 | 360 | 384 | 432 | 439 |
| Off-street surplus | -12 | 272 | 257 | 320 | 348 |
| Total income | 1,118 | 1,697 | 1,807 | 2,008 | 2,163 |
| Total surplus | 320 | 838 | 909 | 1,019 | 1,094 |
| Surplus margin | 29% | 49% | 50% | 51% | 51% |
Source: RAC Foundation, Local Authority Parking Finances in England 2024-25, November 2025, based on 295 of 317 councils. Margin is our arithmetic.
The RAC Foundation's figures are calculated from councils' returns to MHCLG on an as-received cash basis, without provision for bad debts or capital charges. Councils budgeted for a £1,120 million surplus in 2024/25 and fell 2.3% short; the 2025/26 budget is £1,125 million. Parking surpluses were equal to 20.0% of councils' net transport expenditure in 2024/25. Forty-three councils outside London made a loss on parking, with deficits totalling £15.97 million; no London borough did.
London and the rest of England are different businesses
| 2024/25, £ million | London | Rest of England | London share |
|---|---|---|---|
| On-street income | 956 | 421 | 69% |
| Off-street income | 51 | 736 | 6% |
| On-street surplus | 594 | 152 | 80% |
| Off-street surplus | 9 | 339 | 3% |
| Total surplus | 603 | 491 | 55% |
Source: RAC Foundation, 2025.
London's parking economy is kerbside: permits, on-street tariffs and PCNs, with a 62% on-street margin. Outside London it is mostly car parks: off-street income is 64% of the total. Westminster alone made a £90.6 million surplus. Brighton and Hove, at £33.2 million, was the largest outside London. A supplier selling into councils is selling two different products, and a pricing or enforcement technology pitched at one may have little to offer the other.
Off-street income hasn't recovered in real terms
Against the last pre-pandemic year the picture splits:
| Change, 2019/20 to 2024/25 | Nominal (2019/20 edition base) | Real (CPI) | Nominal (restated base) | Real (CPI) |
|---|---|---|---|---|
| On-street income | +34.4% | +7.9% | +35.7% | +9.0% |
| Off-street income | +9.0% | -12.5% | +21.8% | -2.2% |
| Total income | +23.9% | -0.5% | +30.3% | +4.6% |
| Total surplus | +22.7% | -1.5% | +28.4% | +3.1% |
Sources: RAC Foundation 2019/20, 2023/24 and 2024/25 editions; ONS CPI, financial-year averages; Anyway Ventures analysis. The 2023/24 edition restated 2019/20 off-street income from £722 million to £646 million.
The two bases disagree on the size of the effect, because the number of reporting councils differs between editions. They agree on its direction: on-street income is ahead of inflation and off-street car park income is behind it. This matches what operators see. Kerbside demand and enforcement in dense areas recovered fast; town-centre and commuter car parks did not. NCP's administrators blamed exactly that when the company failed in March 2026.
Scotland and Wales
Scotland publishes its own data. Transport Scotland's decriminalised parking enforcement report for 2024/25, published in January 2026, covers 23 authorities. Summing its tables, they had parking income of £133.7 million and expenditure of £60.2 million, a difference of £73.6 million, against a published total balance of £76.9 million. Edinburgh (£45.4 million) and Glasgow (£44.4 million) account for 67% of the income. PCNs issued rose from 540,651 in 2022/23 to 640,924 in 2024/25, an 18.5% rise in two years. The tables contain visible errors (two councils share identical expenditure and balance figures, and several balances don't equal income less expenditure), which we reproduce and flag in the appendix rather than correct.
Wales is a gap. The latest Welsh figures in the RAC Foundation's comparison are for 2021/22 and show negative expenditure, so we have not used them.
6. Payments, apps and the NPP
Cash has gone, but apps haven't won
Cash was 8% of all UK payments in 2025, down from 9% in 2024 and 45% in 2015, according to UK Finance, which says the decline "appears to be slowing". There were 3.9 billion cash payments in 2025, and 65% of adults were registered for a mobile wallet.
Parking is where the move away from cash meets the move to apps, and the evidence is that drivers like the first more than the second. The RAC's 2025 survey of about 1,700 drivers, reported again by the RAC in March 2026, found that 73% of drivers who had paid for parking by app in the previous year had difficulties, and 13% could not work out how to use one. Coverage of the survey put lack of mobile signal at the top of the list of problems, cited by 70%.
| Measure | Figure | Source |
|---|---|---|
| Cash share of UK payments, 2025 | 8% | UK Finance, 2026 |
| Adults registered for a mobile wallet, 2025 | 65% | UK Finance, 2026 |
| App users with difficulties paying for parking | 73% | RAC survey, 2025 |
| Drivers unable to work out how to use a parking app | 13% | RAC survey, 2025 |
| App problem most cited: no signal | 70% | RAC survey as reported by UKAuthority, 2025 |
There is no national figure for the share of parking sessions paid by app, card or cash. Councils publish it occasionally in committee papers, operators almost never. That is the most basic missing number in parking payments.
Councils removing machines
A sample of 2026 decisions shows the direction and the friction:
| Council | What changed | When |
|---|---|---|
| Wirral | Phased removal of pay and display machines: one per car park in 2027/28, none by the end of 2030. The council cited rising maintenance costs; the app adds 6p a transaction | Decided March 2026 |
| Slough | Machines removed; payment by RingGo app or phone with a 20p convenience fee, or cash and card at PayPoint shops | From 30 March 2026 |
| South Tyneside | Coastal car park machines replaced with card-only machines and pay by app | June to July 2026 |
| Somerset | Joined the National Parking Platform; considering ending cash payment in car parks | October 2026 |
This is not a census, and we could not find one. Councils' motives are consistent: machine maintenance, cash collection, mobile connectivity for card payments and the cost of keeping ageing hardware in service. The objections are consistent too: signal, digital exclusion and convenience fees, which is where the National Parking Platform comes in.
The National Parking Platform
The National Parking Platform is a not-for-profit system, started by the Department for Transport and now run by National Parking Platform Ltd, that lets any connected app sell parking at participating sites. In October 2026 it listed 25 live local authorities, 25 live parking operators, 1,890 locations and 18,648,029 transactions a year, with connected apps including PayByPhone, RingGo, JustPark and APCOA. It launched in May 2025. About 10 councils were live in October 2025 and 15 by March 2026. In March 2026 the government said it would issue statutory guidance to push councils to adopt it, with the aim of more than doubling take-up.
The commercial effect is simple to state and hard to measure. Before the NPP, a council's pay-by-phone contract gave one app exclusive access to its sessions. On the NPP, drivers can use whichever connected app they already have. That should reduce the number of apps a driver needs (coverage of the RAC survey reported that 64% had at least two installed) and turn council parking from a contract business into a consumer business. The NPP does not publish transactions by app, so nobody outside the platform can yet see whether open access moves share.
7. The 2026 code and what it changes
What happened
On 20 October 2026, MHCLG laid the Private Parking Code of Practice before Parliament with a certification scheme, a consultation response and a final stage impact assessment. According to the government response, the code will be issued on 30 November 2026 if neither House objects and comes into force 21 calendar days later, replacing the industry's Sector Single Code. UKAS has recognised the certification scheme, but evaluating the conformity assessment bodies that will certify operators is expected to take until around April 2027. Until then the trade associations' sanctions, with loss of DVLA access as the ultimate sanction, continue.
The code freezes the £100 cap with a 40% discount for payment within 14 days; introduces a five-minute consideration period and a ten-minute grace period; bars charges where an ANPR car park is paid before exit; sets out an Appeals Charter of cases where a charge must be cancelled or reduced to £20; requires a recorded manual quality check before ANPR evidence supports a charge; bans incentives tied to the number of charges; and requires operators to keep at least 36 months of data and supply it through their trade association. Our parking sector guide sets out the provisions in detail; this section is about the numbers.
What the impact assessment says
The impact assessment is the most detailed public description of the private parking business that exists, and it is unusually frank about how little the government knows.
| Measure | Figure |
|---|---|
| Charges paid at the discounted rate | 34.1% |
| Charges paid at the full rate | 7.9% |
| Charges paid at the full rate plus debt recovery fee | 3.1% |
| Charges paid at the £20 reduced charge | 1.9% |
| Charges paid at an alternative rate | 1.8% |
| Charges paid in total | 48.9% |
| Charges appealed at first stage | 21% (55% of those succeed) |
| Charges appealed at second stage | 0.90% (49% of those succeed) |
| Cost per second-stage appeal | £27.25 (POPLA), £30 (IAS) |
| Illustrative fall in charges from the code | 5% (range 1% to 9%) |
| Revenue lost by operators per 1% fall, 10 years | £64 million |
| Revenue lost at the illustrative 5%, 10 years | £320 million (range £64m to £576m) |
| Second-stage appeal costs saved at 5%, 10 years | £2.3 million (110,000 fewer appeals) |
| Net present value to business of the adopted package | -£327.5 million |
| Net present value to households | +£320.3 million |
| Net present social value | -£8.0 million |
| Pass-through if fully passed to motorists | About 97p per motorist a year |
Source: MHCLG final stage impact assessment, 2026. Payment and appeal shares are BPA outcome data.
Read the first block carefully: on BPA data, just under half of private parking charges are ever paid. A fifth are appealed to the operator, and more than half of those appeals succeed, so about 11.5% of all charges are cancelled at first stage (our arithmetic: 21% times 55%). Under 1% go on to POPLA or the IAS. The code's Appeals Charter is aimed at that first stage, where most of the cancellations happen and where no independent body publishes any data.
The options the government rejected
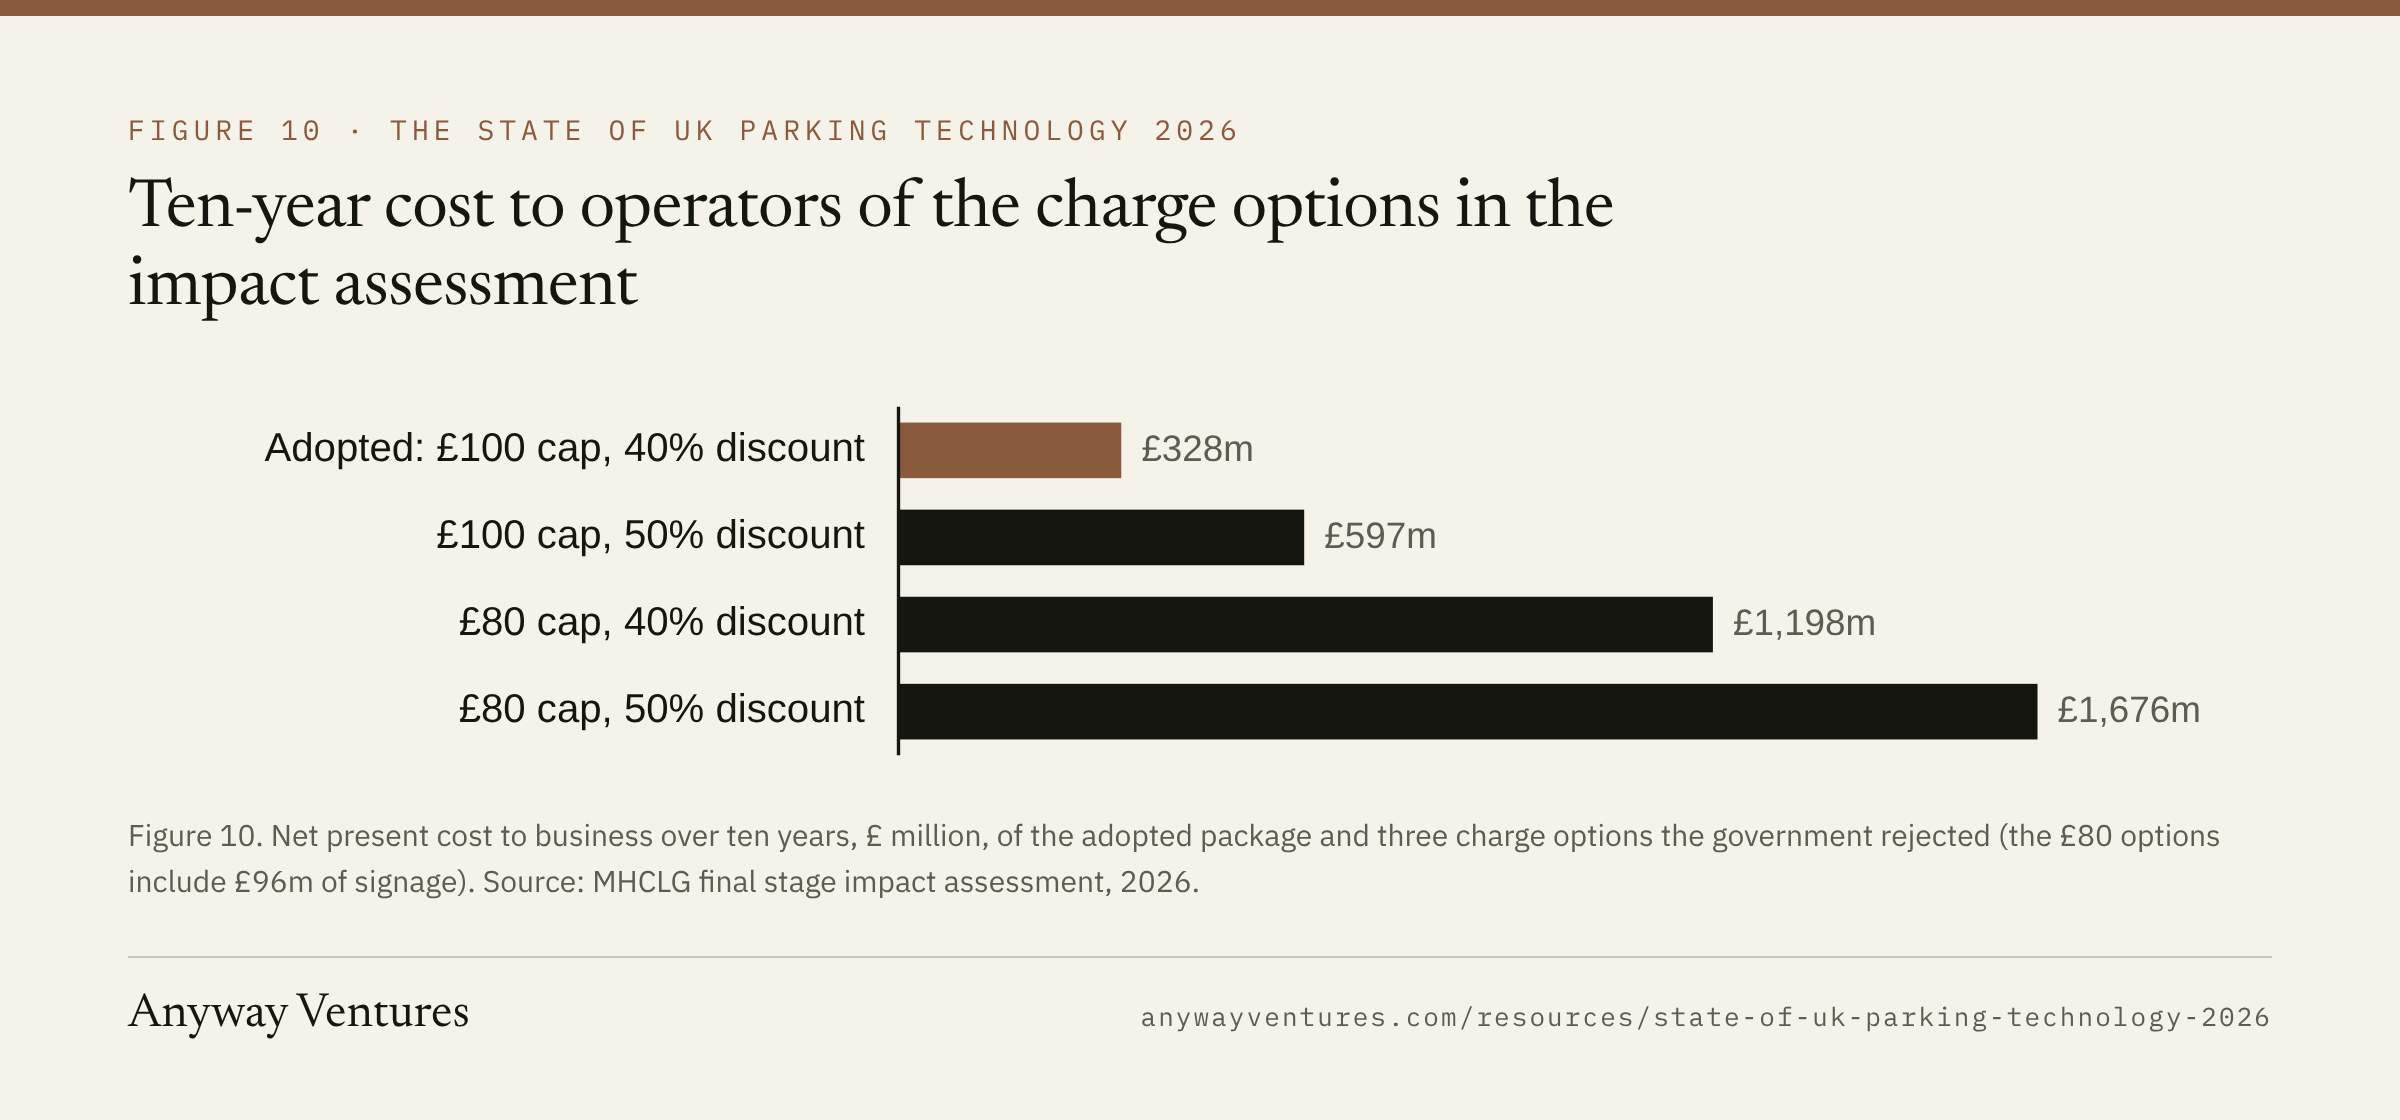
The cap and discount were the most contested choices. The impact assessment costed the alternatives: raising the discount to 50% would have cost operators £596.7 million over ten years, £269 million more than the adopted package; cutting the cap to £80 would have cost £1.198 billion including £96 million of new signage (800,000 signs at £120 each); and an £80 cap with a 50% discount, £1.676 billion. The government froze the cap and asked the new Scrutiny and Oversight Board to review it, and said it may consult on the discount.
What the code's numbers depend on
Every monetised impact scales with one input the government doesn't have: why charges are issued. The impact assessment says it does not have data on "wilful motorist non-compliance, accidental motorist non-compliance, the reasons why parking operators issue parking charges or the scale of operator poor practice", and that this "lack of data is a key driver for mandating the collection of data". Its 5% is described as illustrative, and it says the true impact "may fall outside of this range".
That makes the code's data requirement the most consequential part of it for the industry's future. Once 36 months of standardised operator data reach the associations and the Scrutiny and Oversight Board, the cap, the discount, debt recovery fees and the appeals model will be reviewed on evidence for the first time. Operators that already hold clean event, charge, appeal and cancellation data by site and reason will see the review coming. Those that don't will learn the results with everyone else.
Our view on direction of travel
The keeper data suggests the code arrives into an industry still growing at 15% to 18% a year. A 5% reduction against that counterfactual is a slower rate of growth, not a shrinking market, unless the Appeals Charter, grace periods and the CMA's work change practice by more than the government expects. The CMA's July 2026 action, including an investigation into Euro Car Parks and letters to operators about appeals and extra charges, is a separate pressure on the same lines of revenue.
8. EV charging
The UK had 121,171 public EV chargers on 1 July 2026, according to the DfT, of which 28,887 were rated rapid or above (50kW or more). That is 174.9 per 100,000 people and one for every 17 battery electric vehicles. DfT changed its headline measure from charging devices to EV chargers in January 2026, so long-run growth has to be read on the old measure: public charging devices rose from 28,375 in January 2022 to 97,266 in July 2026, 3.4 times in four and a half years.
| Date | Public charging devices | Growth |
|---|---|---|
| 1 January 2022 | 28,375 | |
| 1 January 2023 | 37,055 | +31% |
| 1 January 2024 | 53,677 | +45% |
| 1 January 2025 | 73,334 | +37% |
| 1 January 2026 | 87,796 | +20% |
| 1 July 2026 | 97,266 | +11% in six months |
Sources: DfT charging statistics for January 2023, January 2025, January 2026 and July 2026. January 2022 derived from the January 2023 release.
For parking, the important statistic is location. DfT classes 52% of public chargers as destination chargers, which includes car parks and slower chargers at hospitality sites, against 33% on-street and 11% en-route. That is about 63,000 destination chargers (our arithmetic). DfT does not publish a count for car parks alone, and growth has slowed: 13,281 chargers were added in 2025 against industry estimates of 24,557 in 2024.
The Public Charge Point Regulations 2023 apply to whoever operates the charge point, not the car park: 99% average reliability across a rapid network, contactless payment on qualifying chargers, pricing in pence per kWh, a free 24/7 helpline and open data. For a car park owner, the commercial questions are who holds the grid connection, who owns the hardware at the end of the contract, how bays are enforced against non-charging vehicles and who gets the data. The regulations require open data on availability and price, but there is still no public data on utilisation by location type, which is what determines whether a car park charger earns its keep.
9. Consolidation and deals
| Date | Buyer or investor | Target | Segment | Terms |
|---|---|---|---|---|
| 2019 | Marston Holdings | Videalert | Council camera enforcement technology | Undisclosed |
| March 2021 (announced) | EasyPark Group | PARK NOW Group, including RingGo, from BMW and Daimler Mobility | Pay by phone apps | Undisclosed |
| July 2022 | Flowbird (Searchlight Capital portfolio) | YourParkingSpace, from Pelican Capital and founders | Pre-book marketplace | Undisclosed |
| August 2022 | Smart Parking | NE Parking, 517 manually operated sites | Operator roll-up | A$0.5m |
| September 2022 | Synova | Unity5, maker of ZatSuite and Zatpark | Enforcement and permit software | Undisclosed |
| March 2024 | Smart Parking | Local Parking Security, 126 sites, 72 with ANPR | Operator roll-up | A$5.8m |
| March 2024 | ParkHub, FTV Capital, LLR Partners | Merger with JustPark | Apps and parking software | Undisclosed |
| June 2024 | Q-Park | Britannia Parking, 600+ car parks | Car park operator | Undisclosed |
| January 2025 | EasyPark Group | Flowbird, used in 4,350 cities in 80 countries | Terminals, apps, transit payments | Undisclosed; CMA phase 1 clearance, August 2024 |
| February 2025 | EasyPark Group | Parkopedia | In-car parking data and payments | Undisclosed |
| June 2025 | EasyPark Group | Renamed Arrive | Group of seven brands | n/a |
| September 2025 | Intelli-Park | Total Parking Solutions, after Bank Park in 2024 | Regional ANPR roll-up | Undisclosed |
| March 2026 | JustPark | BigParking, 120+ event locations | Event parking inventory | Undisclosed |
| March 2026 | Administration (PwC) | National Car Parks, about 340 car parks | Leasehold operator | n/a |
| October 2026 | APCOA | UK Parking Patrol | Enforcement operator | Undisclosed |
| October 2026 | Martin Property Group | NCP business out of administration, 145 car parks and 276 staff | Distressed leasehold estate | Undisclosed |
Sources as linked. The list is restricted to UK businesses and groups that own UK parking brands, and excludes minority funding rounds. It is not exhaustive.
The pattern since 2019 has three strands.
Distribution consolidated into one group. EasyPark bought RingGo with PARK NOW, then Flowbird (which already owned YourParkingSpace), then Parkopedia, and renamed itself Arrive with EasyPark, Flowbird, ParkMobile, Parkopedia, RingGo, Yellowbrick and YourParkingSpace under one roof: terminals on the street, apps on the phone, a marketplace for private inventory and payment in the dashboard. The CMA cleared the Flowbird deal at phase 1. A buyer that already owns the leading council app bought the leading terminal maker and the leading in-car data provider, which tells you where strategic buyers think the value in parking payments sits.
Operators rolled up enforcement estates. Smart Parking's two disclosed UK deals are the only ones in our list with prices: A$0.5 million for 517 manually operated sites at NE Parking and A$5.8 million for 126 Local Parking Security sites, 72 of them with ANPR. Intelli-Park bought Bank Park and Total Parking Solutions; APCOA bought UK Parking Patrol; Q-Park bought Britannia. The keeper data shows the same consolidation from another angle: the top five's share of requests rose five points in 2025/26.
Property risk stayed property risk. NCP's administration and sale left 145 of about 340 car parks and 276 staff with Martin Property Group. Its keeper requests (723,750 in 2025/26) held up through the year, which suggests enforcement income was not the problem. Leases were.
What the table can't tell you is price. Fourteen of the sixteen entries have undisclosed or not applicable terms, and the two disclosed prices are small. We found no verified valuation multiples for UK parking transactions and have not estimated any. Anyone citing a "parking multiple" should be asked for the deal and the source.
10. Technology and AI: where the industry is
This is the section where the honest answer is mostly "we don't know". Here is everything we could verify, and the rest.
| Measure | What is known | Status |
|---|---|---|
| ANPR coverage of private parking | About 80%, rising about 4 points a year | Industry estimate quoted in the impact assessment |
| Growth in ANPR-managed sites, 2018 to 2022 | +80% | BPA data quoted in the impact assessment |
| UK ANPR site market | 45,000 sites | Smart Parking estimate |
| Keeper requests per year | 16.9 million and rising | DVLA, published |
| Cashless share of parking sessions | Not published nationally | Gap |
| ANPR capture and read rates | Not published by any operator | Gap |
| Operators using AI in evidence review or appeals | Not published | Gap |
| AI in UK businesses generally | About 35% of businesses with 10 or more employees, up from about 12% in late 2023 | ONS, July 2026, no parking breakdown |
| Parking bookable inside an AI assistant | JustPark in ChatGPT, 150,000+ spaces, September 2026 | Company announcement |
ANPR is the industry's technology story, and the data proves it
The strongest evidence of technology adoption in parking isn't a survey. It's the DVLA series. The impact assessment links post-Covid growth in keeper requests mainly to ANPR, which records every entry and exit and turns a non-payment into a candidate charge without a patrol. Keeper requests grew 2.5 times in seven years while the number of private parking spaces, on the government's estimate, did not. The one public example of an operator's unit economics points the same way: Smart Parking runs 1,525 UK sites at a 30.5% adjusted EBITDA margin, describes its "SmartCloud AI" platform as proprietary, and calls itself camera-agnostic because the value sits in software rather than hardware.
The government's ANPR estimate also tells you where the conversion boom ends. At 80% coverage and four points a year, the remaining manual and patrol estate converts within about five years, which is why the impact assessment's projection tapers to zero growth by 2032/33. After that, keeper request growth has to come from new sites, more enforcement per site or both, and the code is designed to limit the second.
AI: claims, not data
Parking companies describe AI in plate reading, evidence review, appeals triage, customer service, reconciliation, occupancy forecasting and pricing. We found no independent, published measure of how many UK operators use AI for any of these, or of its effect on charge volumes, cancellation rates or appeal outcomes. The ONS's business survey puts AI use at about 35% of UK firms with ten or more employees but does not separate parking. We have not used vendor claims as data.
Two pieces of the code make the question measurable. The requirement for a recorded manual quality check before an ANPR image supports a charge sets a hard boundary on automation: AI can speed up and improve that check but cannot replace the named person who makes it. And the 36-month data requirement, once published in aggregate, will show cancellation and appeal outcomes by reason, which is the only honest way to tell whether AI-assisted evidence review issues fewer bad charges.
On the consumer side, the direction is clearer. JustPark made more than 150,000 UK spaces searchable inside ChatGPT in September 2026 using Model Context Protocol, with the booking completed on JustPark. Consumer tools that draft appeals against the Appeals Charter are already marketed. Both reduce the cost of comparison and of complaint, and both will show up first in the data operators hold, not in public statistics.
What would change our view
A published operator-level series of charges issued, cancellations by reason and appeals by outcome would tell us more about the state of parking technology than any survey of AI adoption. So would per-camera read rates submitted as certification evidence. Until those exist, the most reliable public indicator of the industry's technology is still the DVLA's spreadsheet.
11. What it means for investors
The growth is real, regulated and finite. Private enforcement volume has compounded at 13.9% a year since 2018/19 and the government expects it to keep growing until ANPR saturates around 2032/33. A deal model that assumes a decade of 15% volume growth is assuming the conversion boom continues past the point the government's own projection says it ends, and before the code's data starts to change policy.
Underwrite revenue per charge, not charges. Smart Parking's FY26 shows the sensitivity: 4% more notices, 62% more revenue, with A$7.0 million of EBITDA from debt resolution changes. Debt recovery fees stay capped at £70 as what the government calls an interim measure, and it intends to consult again on a lower cap or a ban. For any operator, split revenue into tariffs, management fees, charges paid at discount, charges paid in full, debt recovery uplift and £20 reduced charges, and run the code's grace periods and Appeals Charter against the target's own history. The impact assessment's payment shares (34.1% at discount, 7.9% in full, 3.1% with a debt recovery fee) are a useful benchmark for that split.
Use the DVLA data as a market share tool. The KADOE workbook is the only public, operator-level, monthly measure of activity in private parking. It shows who grew fastest in 2025/26 (Horizon and CP Plus, both up 27%), who was flat (Smart Parking, NCP and Parkmaven, all up 2% or less), who fell (Civil Enforcement, down 6%) and who made a step change (APCOA). Volume is not sites, but a target whose growth claims don't show up in its own KADOE line has some explaining to do. It costs nothing and most information memoranda don't use it. Cross-check a target's claimed growth against its own KADOE line before management presentations.
Price the audit and appeals record. Forty per cent of audited operators were rated red in 2024/25, and the second largest requester is on the RAC's list of repeat red ratings. Under the code, certification decides DVLA access. The audit reports, POPLA or IAS outcomes by site and the operator-not-contested rate belong in the first data request, not the confirmatory one. In POPLA's 2025 data, the share of appeals not contested ranged from 23% (CP Plus) and 24% (ParkingEye) to 62% (Euro Car Parks) and 78% (NCP); a high rate can mean good judgement about weak cases, or weak cases.
Expect consolidation to continue, and price it without multiples. The impact assessment expects smaller operators to exit or sell. The top five's share has already started rising. With almost no disclosed prices, value each revenue line on its own drivers. Our technical due diligence checklist covers the platform side; the parking-specific questions are in our sector guide.
In payments, distribution has been bought. Arrive owns the leading council app, the leading terminal maker, a marketplace and in-car payment. The NPP is opening council inventory to every connected app, and AI assistants are starting to search inventory. A standalone app valued on council contract volume needs a hard look at NPP exposure and at whether drivers choose it or were given it. The AI disruption risk scorecard is a quick way to score each revenue line.
Council-facing businesses sell into two markets. On-street parking is a London-weighted enforcement and permits business with surpluses ring-fenced for transport. Off-street is a car park business outside London whose income is still below 2019/20 in real terms. A council software or hardware business should show revenue by those two markets and by procurement cycle.
Leases are the risk technology doesn't fix. NCP's enforcement volume held up while the company failed. Fixed rent against demand that hasn't recovered is the clearest single cause of distress in the sector.
12. What it means for operators
Your data is about to become public in aggregate. The code requires 36 months of data, supplied through the associations to a Scrutiny and Oversight Board that will review the cap, discount, debt recovery and appeals. The operators best placed for that review are those who already know their charges per 1,000 visits, cancellation rates by reason and appeals by outcome, by site. If you can't produce those today, that is the first project.
Fix first-stage appeals before the Appeals Charter fixes them for you. On BPA data, 21% of charges are appealed at first stage and 55% of those succeed. That is about one charge in nine cancelled after issue, each with its handling cost, and it's where the Appeals Charter applies. Every charge that would be cancelled under the Charter is cheaper never to issue. Pre-issue evidence checks, keying-error matching against vehicles on site and grace and consideration logic in the back office are the controls that move this number.
Treat the DVLA audit as a certification rehearsal. Red ratings have not visibly constrained volumes so far. Under the code, certification bodies, not trade association points, will decide DVLA access, with annual surveillance and intelligence-led audits. The evidence the GIAA tests (lawful basis, retention, security, sample charges, ANPR controls, user access) is what a conformity assessment body will sample.
Plan for ANPR saturation. If coverage is 80% and rising four points a year, the easy growth from converting patrol sites ends within about five years. Growth after that comes from winning sites and from better pricing and services, not from more charges per site.
Offer two ways to pay. Cash is 8% of UK payments, but 73% of app users report difficulties and signal is the most common problem. The code makes an alternative means of payment best practice and requires charges to be cancelled where machines are out of order with no reasonable alternative. On sites with poor signal, an app-only estate is a cancellation and complaint generator.
Join the platforms that are opening distribution. For council-facing businesses, the NPP is becoming the default, and statutory guidance is coming. For private operators, connected apps, in-car payment and AI assistant search are new routes to drivers. The operator that publishes clean inventory, prices and rules to those channels gets the booking; the one that doesn't gets the enforcement case.
Use AI where it lowers cancellations and costs, and measure it. Evidence review, appeals triage, customer contact and reconciliation are document-heavy work against rules. Set a baseline (charges issued, cancellations by reason, cost per appeal, contacts per 1,000 sessions) before any tool goes live, because the only credible claim about AI in parking will be one backed by those numbers.
13. Data gaps and what we'd like the industry to publish
| Gap | Why it matters | Who could publish |
|---|---|---|
| Parking charges issued, by operator | Keeper requests are a proxy; they miss tickets paid early and count repeat requests | BPA and IPC, using the code's data |
| Charges by contravention type | The impact assessment could not estimate the code's effect without it | Operators via the associations |
| Appeal outcomes by operator, both services, on a common year | POPLA publishes by operator; the IAS does not; neither matches the DVLA year | POPLA, IAS |
| GIAA audit ratings by operator, every year | Only FOI releases exist | DVLA |
| Council PCNs issued across England | No single national series outside London | MHCLG, DfT, Traffic Penalty Tribunal |
| Cashless share of parking payments | Drives machine removal and accessibility decisions | Councils, operators, NPP |
| NPP transactions by app | Shows whether open access moves share | National Parking Platform Ltd |
| ANPR capture and read rates | The hidden driver of wrongful charges | Operators, camera vendors |
| Charger utilisation in car parks | Installed counts say little about returns | DfT, charge point operators |
| Welsh council parking finances | Latest comparable data is 2021/22 | Welsh Government |
| Deal terms | Almost no UK parking deal discloses a price | Buyers, sellers, advisers |
The 2026 code solves some of this. Its data requirement covers ANPR events, charges by value band, appeal outcomes by reason, payment facilities and enforcement methods by site, and second-stage appeals services must publish annual reports showing appeals received, decided in the motorist's favour and why. If the associations publish aggregate tables by operator on an April to March year, matched to the DVLA's, most of the first four gaps close at once. We would add three requests: a published charges-per-1,000-visits figure by operator, a national cashless share from the NPP and councils, and annual publication of GIAA ratings.
We will update this report as the data arrives. If you hold any of these datasets and can publish them, we'd like to hear from you.
14. Sources
Primary datasets
- DVLA, KADOE volumes workbook, 2018/19 to 2025/26, published August 2026, via Who DVLA shares data with.
- MHCLG, Private Parking Code of Practice: final stage impact assessment, October 2026; code collection; government response.
- RAC Foundation, Local Authority Parking Finances in England, 2024-25 (November 2025), 2023-24 and 2019-20 editions.
- Transport Scotland, Decriminalised Parking Enforcement report 2024-2025, January 2026.
- POPLA, 2025 annual report and appendix; annual report releases for 2024, 2023, 2022, 2020 and 2019.
- Independent Appeals Service, Annual Report 2024-2025.
- Traffic Penalty Tribunal, Annual Report 2024-25.
- DfT, EV charging infrastructure statistics, 1 July 2026, and earlier releases for January 2025 and January 2023.
- ONS, CPI index (D7BT) and Artificial intelligence in UK businesses, 2023 to 2026, July 2026.
- UK Finance, UK Payment Markets press release, August 2026.
- National Parking Platform, npp.org.uk, October 2026.
- Public Charge Point Regulations 2023.
Analysis, reporting and company sources
- RAC, Record 17 million private parking tickets, August 2026; GIAA audit analysis, October 2026; NPP and app survey, March 2026.
- UKAuthority, RAC highlights problems with mobile apps for parking, October 2025.
- CMA, Parking charges: CMA takes action, July 2026; EasyPark / Flowbird merger inquiry.
- TransportXtra, Government to promote take-up of the National Parking Platform, March 2026.
- Smart Parking, FY26 results presentation, August 2026.
- PwC, NCP administration and sale of the business, 2026.
- Council announcements: Wirral, South Tyneside; press reports on Slough and Somerset.
- Deal sources are linked in the table in section 9.
Other useful free resources. The RAC Foundation's annual council parking reports are the standard reference for council finances, and the RAC's FOI work on keeper data and audits is the best ongoing coverage of private enforcement. The government's impact assessment is the most detailed public description of the private parking business. For a practitioner view of parking technology due diligence, see our parking sector guide.
15. About
This report was researched and written by Anyway Ventures, led by Brannan Coady, formerly Chief Product Officer, COO and CEO of YourParkingSpace (2016 to 2024), a member of the Flowbird executive committee and part of the deal team for Flowbird's sale to EasyPark, now Arrive. Anyway Ventures runs technical due diligence and AI work for investors and operators. Version 1.0, October 2026. Free to use, adapt and share with attribution ("Anyway Ventures, The state of UK parking technology 2026"). Not legal, tax or investment advice.
For journalists and researchers
You are welcome to quote the findings and reuse the charts and data, in print or online, free of charge. Please credit Anyway Ventures and, online, link to this page. For interviews, comment or the underlying workings, email brannan@anywayventures.com. Replies come from Brannan Coady.
Coady, B. (2026). The state of UK parking technology 2026. Anyway Ventures. https://anywayventures.com/resources/state-of-uk-parking-technology-2026
The charts, ready to use
DOWNLOAD ALL 11 · ZIP · 1.7 MB ↓High-resolution PNGs, each with its title, source line and a link back to this report.
Questions
How many private parking tickets are issued in the UK each year?
Nobody publishes a direct count. The best proxy is DVLA keeper requests, which private operators make to find the registered keeper of a vehicle before pursuing a charge. They made 16,900,805 requests in 2025/26, up 17.6% on the previous year and 2.5 times the 2018/19 level. The real number of charges is somewhat different: windscreen tickets paid early never need a keeper request, and some vehicles are requested more than once. Smart Parking's UK figures suggest the two counts are close for an ANPR-heavy operator.
Which parking companies request the most DVLA data?
In 2025/26 the largest requesters were ParkingEye (2.52 million), APCOA (2.26 million), Euro Car Parks (2.03 million), Horizon Parking (1.11 million) and Smart Parking (0.80 million). Together the top five made 51.5% of all private parking keeper requests, up from 46.3% a year earlier. APCOA's requests rose 135% in the year. The figures come from the DVLA's published KADOE workbook, grouped by us into operator groups where a business appears under more than one name.
How much do councils make from parking in England?
The RAC Foundation's analysis of 295 of 317 English councils found parking income of £2.163 billion in 2024/25, costs of £1.07 billion and a surplus of £1.094 billion. London boroughs made 55% of the surplus. On-street income was £1.376 billion and off-street £787 million. On-street surpluses must by law be spent on transport. Adjusted for inflation, off-street car park income is still below its 2019/20 level, while on-street income is above it.
What does the 2026 private parking code cost operators?
The government's final stage impact assessment puts the net cost to business of the adopted package at £327.5 million over ten years. Almost all of that is an illustrative 5% fall in parking charges, worth £320 million to motorists, with a stated range of 1% to 9%. The assessment says the true effect is unknown because there is no data on why charges are issued. Keeping the 40% early payment discount, rather than raising it to 50%, avoided a further £269 million.
How many councils use the National Parking Platform?
The National Parking Platform listed 25 live local authorities, 1,890 parking locations and about 18.6 million transactions a year in October 2026. It launched in May 2025 and had about 10 councils live in October 2025 and 15 by March 2026. The government has said it will issue statutory guidance to push more English councils to join. Connected apps include RingGo, PayByPhone, JustPark and APCOA Connect.